
Figure 5.
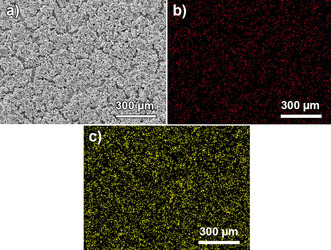
Energy‐dispersive X‐ray spectroscopy mappingof a sulfur cathode coating with a 60 μm thickness. SEM image (a) and associated distributions of carbon (b, red) and sulfur (c, yellow).
Official websites use .gov
A
.gov website belongs to an official
government organization in the United States.
Secure .gov websites use HTTPS
A lock (
) or https:// means you've safely
connected to the .gov website. Share sensitive
information only on official, secure websites.
Energy‐dispersive X‐ray spectroscopy mappingof a sulfur cathode coating with a 60 μm thickness. SEM image (a) and associated distributions of carbon (b, red) and sulfur (c, yellow).