
FIGURE 1.
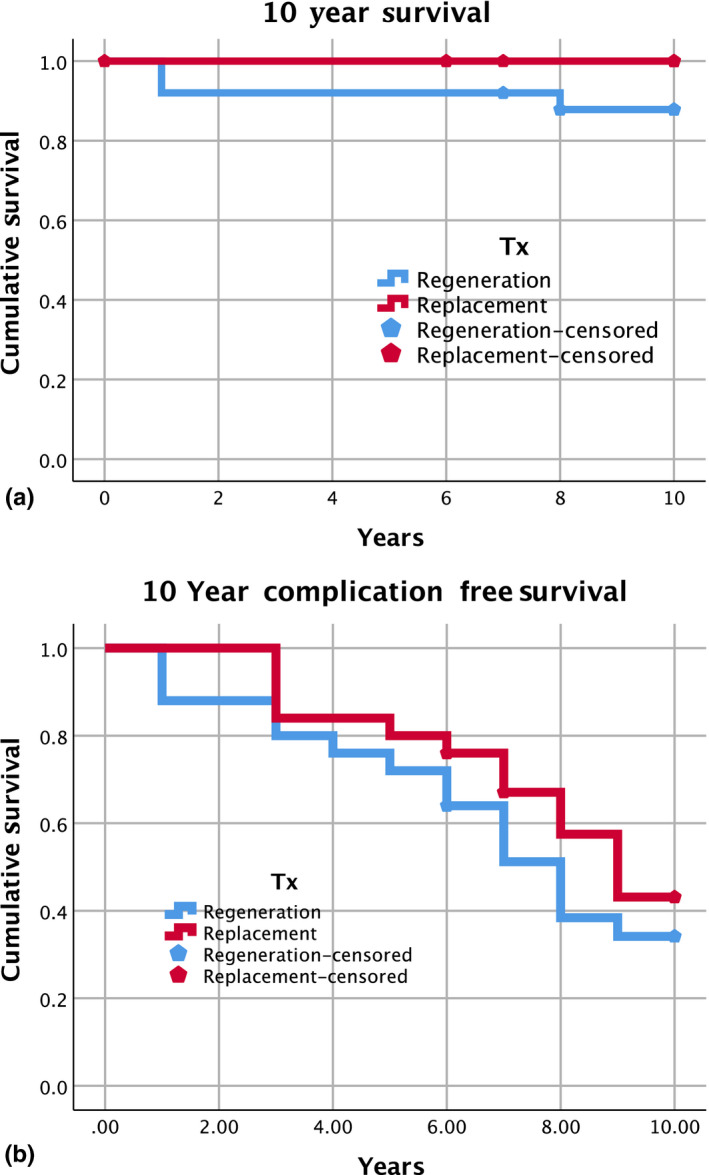
10‐year survival of regenerated teeth and tooth replacement. Kaplan–Maier 10‐year survival plot (a) and complication‐free survival plot (b) of regenerated teeth (blue line) and prosthetic tooth replacement after extraction (red line). Events and censored observations (loss to follow‐up is displayed for each curve)