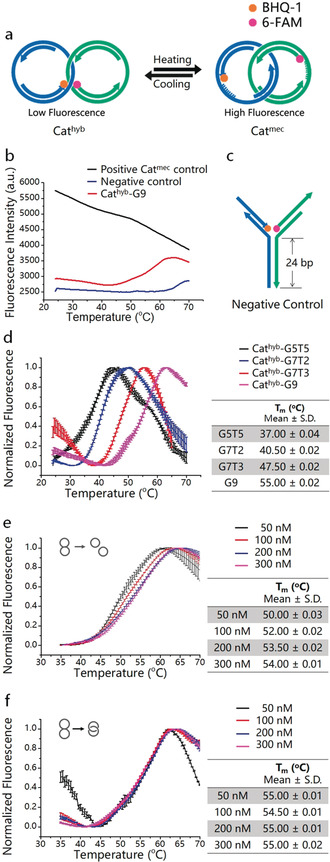
Figure 2.

Thermal switching between Cathyb and Catmec. a) Schematic depiction of the mechanism of thermal switching of the Cathyb to Catmec. b) Temperature‐dependent fluorescence intensity of 20 μL of 100 nm Cathyb‐G9 with an initially quenched FAM (red), 20 μL of 100 nm Catmec positive control that has a non‐quenched FAM (black), and 20 μL of 100 nm of the Y‐shaped negative control (blue). c) Structure of the Y‐shaped negative control construct (for structures and sequences see the Supporting Information, Figure S3 and Table S2). d) Temperature‐dependent fluorescence intensity of Cathyb‐G5T5 (black), Cathyb‐G7T2 (blue), Cathyb‐G7T3 (red), and Cathyb‐G9 (pink; S.D., n=3). e) Temperature‐dependent fluorescence intensity of hybridized but non‐interlocked ring A and ring B with HR of G9 at 50 nm (black), 100 nm (red), 200 nm (blue), and 300 nm (pink; S.D., n=3). f) Temperature‐dependent fluorescence intensity of the Cathyb‐G9 at 50 nm (black), 100 nm (red), 200 nm (blue), and 300 nm (pink; S.D., n=3).
