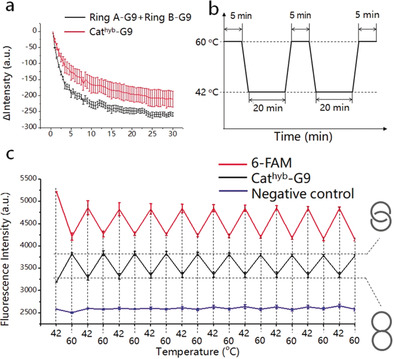
Figure 3.

Thermal reversibility of the Cathyb to Catmec interconversion. a) Time‐dependent change of fluorescence intensity of the mixture of ring A‐G9 and ring B‐G9 (black, 100 nm) and the Catmec‐G9 (red, 100 nm) in DC buffer (S.D., n=3). b) Diagram of the temperature cycling between 42 °C and 60 °C. c) Fluorescence intensity of 6‐FAM (red), Cathyb‐G9 (black), and the quenched negative control (blue) at 42 °C and 60 °C (S.D, n=3).
