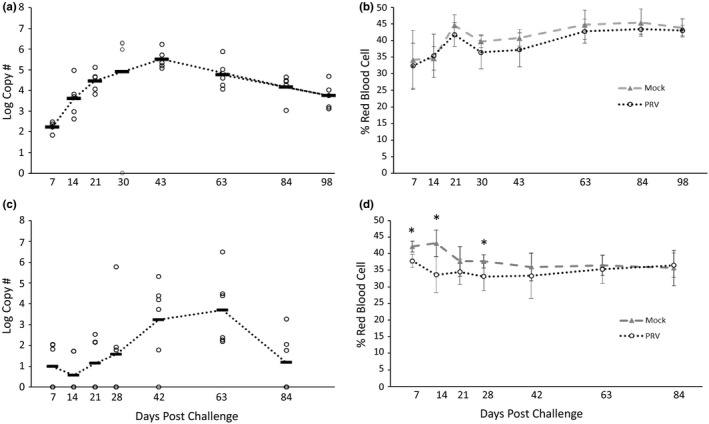
FIGURE 1.

Piscine orthoreovirus (PRV) log viral RNA transcript levels (copy number per 1.5 µg RNA) in kidney/spleen tissues and corresponding haematocrit values (% red blood cells) from (a, b) Chinook salmon (Oncorhynchus tshawytscha Walbaum) injected with minimal essential medium (mock) or PRV+ homogenates, and (c, d) rainbow trout (Oncorhynchus mykiss Walbaum) injected with buffer or PRV+ homogenates. For viral RNA transcript graphs (a, c), each circle represents a single fish and the dark line indicates the mean of the group. All fish injected with medium tested negative for PRV viral RNA (data not visible on graphs a, c). For haematocrit graphs (b, d), each point represents the group mean (±SD). Asterisks denote significant differences between groups at a time point (t test; p < .05)
