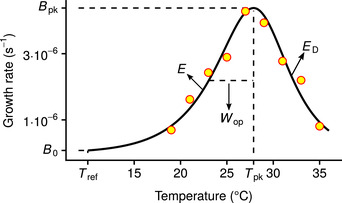
Figure 1.

The relationship of growth rate () with temperature in ectotherms (the thermal performance curve; TPC). The TPC is generally unimodal and asymmetric, here quantified by the four‐parameter Sharpe‐Schoolfield model (black line; Schoolfield et al. 1981) fitted to growth rate measurements of the dinoflagellate Amphidinium klebsii (Morton et al. 1992). The parameters of the model are B 0 (in units of s−1), E (eV), (K), and (eV). B 0 is the growth rate at a reference temperature below the peak () and controls the vertical offset of the TPC. E sets the rate at which the curve rises and is, therefore, a measure of thermal sensitivity at the operational temperature range. is the temperature at which growth rate is maximal, and controls the fall of the curve. Two other parameters control the shape of the curve and can be calculated from the four main parameters: (s−1); the maximum height of the curve, and (K); the operational niche width, which we define as the difference between and the temperature at the rise of the curve where growth rate is half of . Further information regarding the assumptions of the model are provided in the section “Estimation of TPC parameter values” of the Methods.
