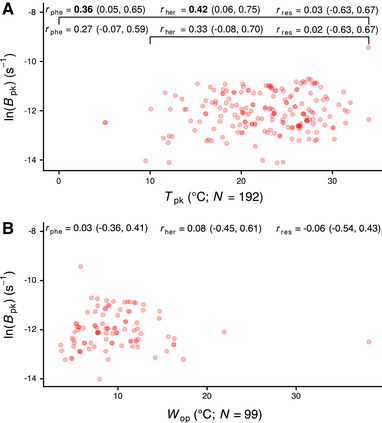
Figure 3.

The relationship of with (A) and (B). , , and stand for phenotypic correlation, phylogenetically heritable correlation, and residual correlation, respectively. The three correlation coefficients were simultaneously inferred after correcting for phylogeny and for environmental effects (latitude). For panel (A), in particular, correlations were estimated across the entire dataset, and after excluding data points with C. The reported estimates are for the correlation of ln() with and ln(), respectively, but the horizontal axes are shown in linear scale for simplicity. Values in parentheses correspond to the 95% HPD interval of each correlation coefficient. Correlation coefficients whose 95% HPD interval did not include zero are shown in bold.
