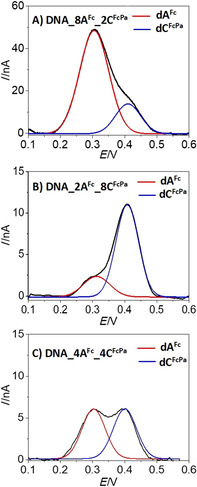
Figure 4.

Square wave voltammograms of the oxidation peaks of dAFc and dCFcPa on PEX products and then hybridized to a complementary surface tethered thiol‐end sequence for detection. The black traces correspond to the experimental SWV signals for dAFc/dCFcPa ratios equal to: 8:2 (A), 2:8 (B) and 4:4 (C). Red and blue traces correspond to the deconvoluted signals of dAFc and dCFcPa, respectively. SWVs were recorded in 0.1 m Ca(NO3)2 vs. Ag/AgCl reference electrode.
