Figure 1.

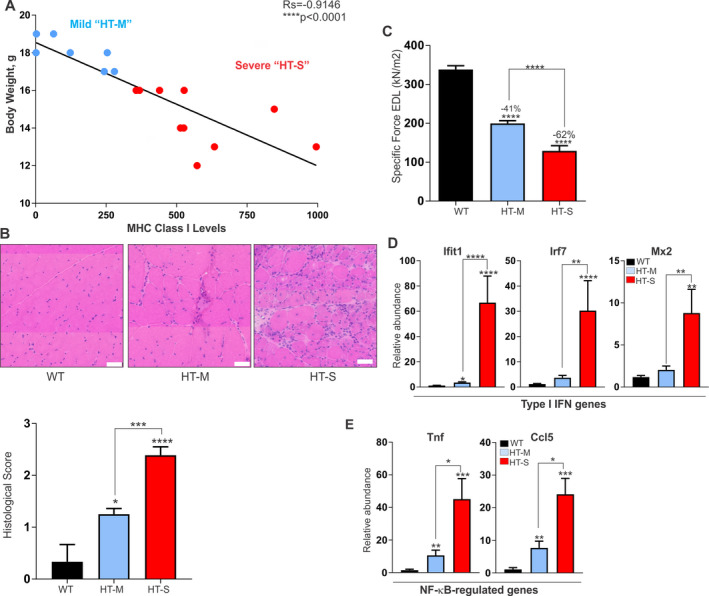
Variable disease severity in the HT mouse model of myositis. A, Classification system used for grouping HT mice according to the severity of myositis, based on body weight plotted against the extent of major histocompatibility complex (MHC) class I transgene expression. HT‐M = mice with mild myositis, body weight of >16 grams, and MHC class I expression of ≤300‐fold relative to wild‐type (WT) mice. HT‐S = mice with severe myositis, body weight of <16 grams, and MHC class I expression of >300‐fold relative to WT mice. Correlations were determined using Spearman's correlation coefficients. B, Representative images of histologic staining with hematoxylin and eosin (top) and histologic scores of staining (bottom) of the quadriceps muscle from WT mice and mice in the mild or severe myositis groups (n = 5 WT, n = 7 HT‐M, and n = 10 HT‐S). Bars = 50 μM. C, Isolated measurements of specific force contractions of the extensor digitorum longus (EDL) muscle in each group of mice (n ≥ 10 per group). D and E, Type I interferon (IFN) gene expression levels (genes for IFN‐induced protein with tetratricopeptide repeats 1 [Ifit], IFN regulatory factor 7 [Irf7], and MX dynamin like GTPase 2 [Mx2]) (D) and NF‐κB–induced gene expression (genes for tumor necrosis factor [Tnf] and C–C motif chemokine ligand 5 gene [Ccl5]) (E) in the quadriceps muscle of WT, HT‐M, and HT‐S mice (n = 5 WT, n = 7 HT‐M, and n = 10 HT‐S). Data were normalized to the values for 18S ribosomal RNA. Results in B–E are the mean ± SEM. * = P < 0.05; ** = P < 0.01; *** = P < 0.001; **** = P < 0.0001 for the indicated comparisons or versus WT mice, by analysis of variance.
