
FIGURE 2.
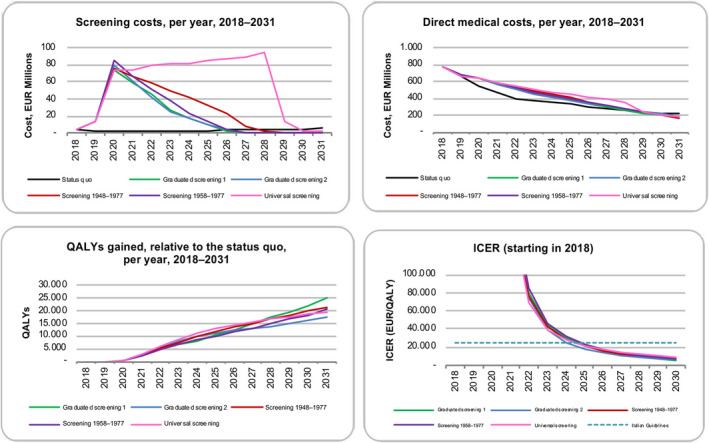
Economic impact of scenarios as measured by screening costs, direct medical costs, QALYs gained relative to the status quo and 13‐year ICER, by scenario, 2018‐2031. EUR, euros; ICER, incremental cost‐effectiveness ratio; QALYs, quality‐adjusted life year