
FIGURE 4.
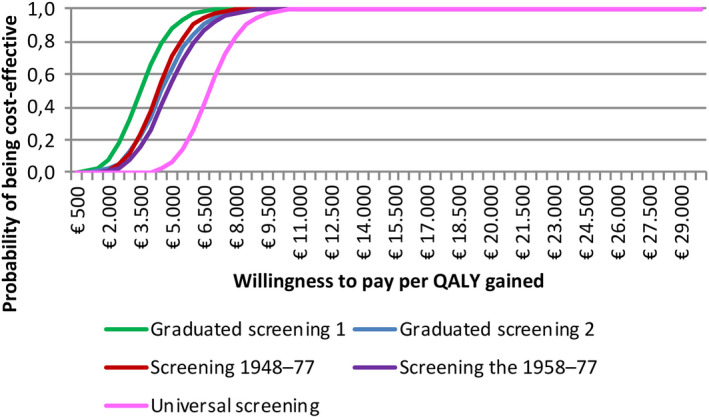
Cost‐effectiveness acceptability curve, by scenario. The cost‐effectiveness acceptability curve shows the proportion of Monte Carlo simulations resulting from varying cost and QALY (quality‐adjusted life year) parameters that are cost‐effective given a willingness to pay threshold. QALY, quality‐adjusted life year