
FIGURE 5.
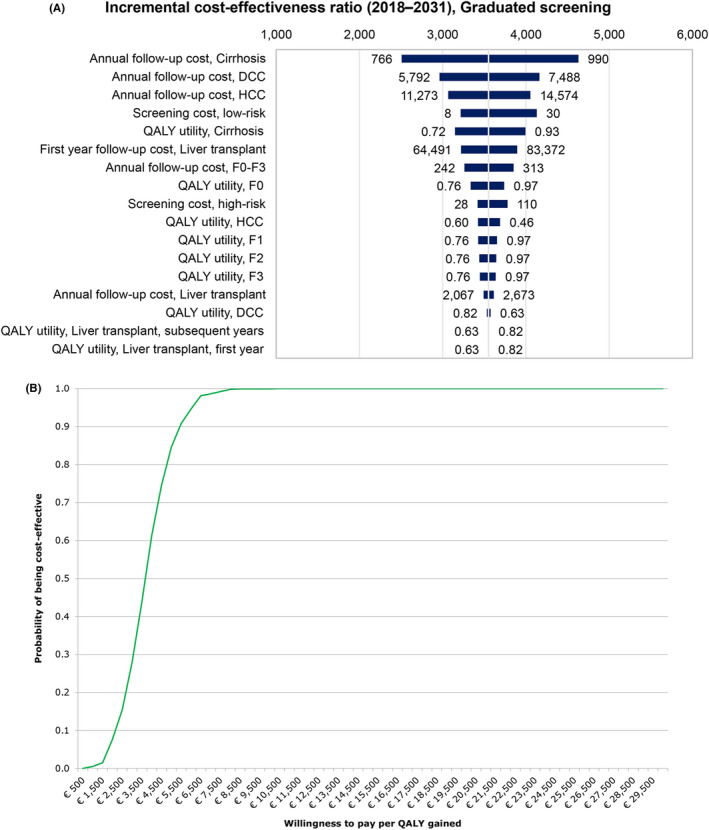
A, One‐way sensitivity analysis for the 2018‐2031 incremental cost‐effectiveness ratio, including uncertainty in cost of screening, graduated screening 1 scenario. B, Cost‐effectiveness acceptability curve, including uncertainty in cost of screening, graduated screening 1 scenario. DCC, decompensated cirrhosis; HCC, hepatocellular carcinoma; QALY, quality‐adjusted life year