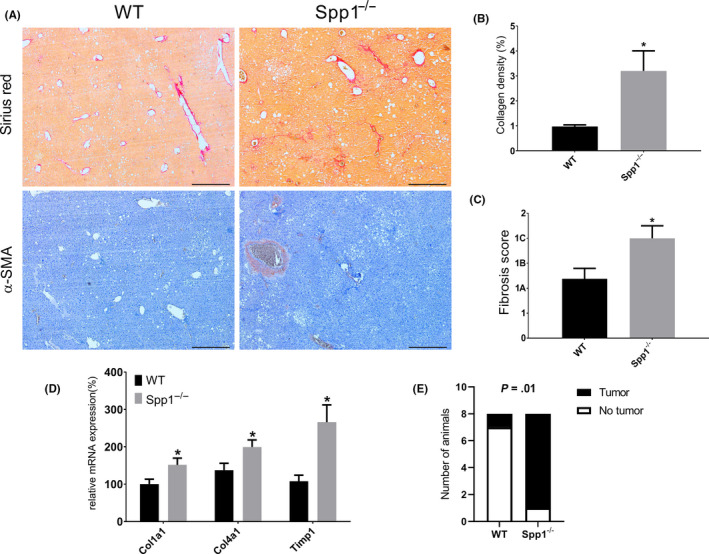
FIGURE 3.

OPN protects against NAFL/NASH‐induced hepatic fibrosis. A, Representative Sirius red (upper panels) and α‐SMA (lower panels) stained sections of WT (left panels) and Spp1 −/− (right panels) NASH‐HCC livers. Scale bar = 500 µm. B, Collagen deposition (red signal) was quantified in an automated fashion. C, Fibrosis score, qualitatively assessed on H&E‐stained liver sections by an expert pathologist, blind to the genotype. D, Gene expression analysis of the main pro‐fibrogenic markers. E, Tumour incidence at the fibrosis stage (week 12). *P ≤ .05. Tissues were harvested from 12‐week‐old mice (n = 8 per group)
