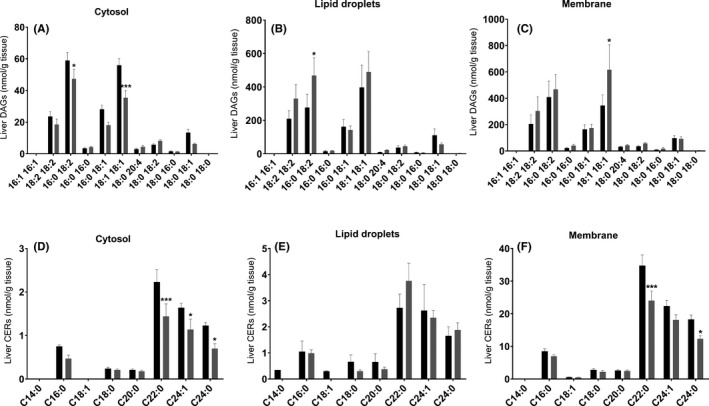
FIGURE 5.

Targeted lipidomic analyses at the NAFL/NASH time point. A‐C, Total amount of individual DAG species in the (A) cytosolic, (B) lipid droplet and (C) membrane fraction. D‐F, Total amount of each individual CER species per cellular fraction. Black bars represent WT, while grey bars Spp1 −/− animals. *P ≤ .05, **P ≤ .01, ***P ≤ .001. Tissues were harvested from 8‐week‐old mice (n = 8 per group)
