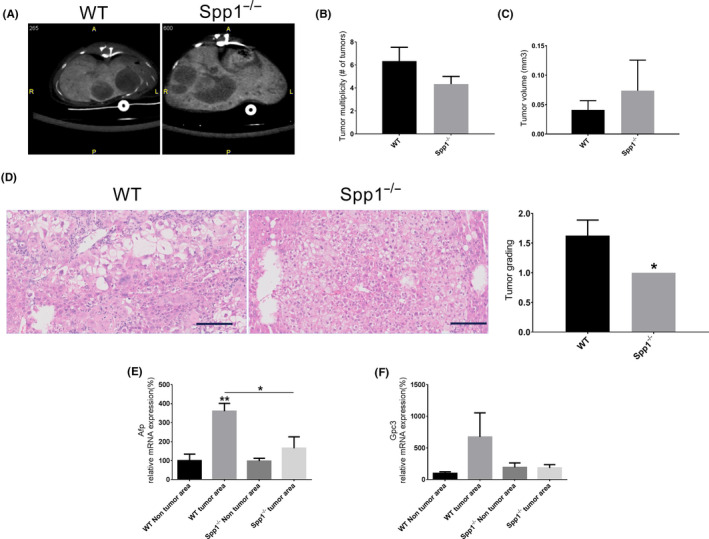
FIGURE 6.

Lack of OPN prevents HCC dedifferentiation. A, Representative in vivo liver X‐ray computed tomography (CT) sections from WT (left panel) and Spp1 −/− (right panel) NASH‐HCC mice. B, Number of tumours per liver and (C) tumour volumes were quantitatively evaluated in an automated fashion. D, Tumour grading was histologically evaluated on H&E‐stained liver sections by an expert pathologist, blind to the genotype. E‐F, Gene expression analysis of the HCC markers Afp (E) and Gpc‐3 (F) in both tumour and non‐tumour areas. Tissues were harvested from 19‐week‐old mice. n = 3 per group for CT analyses, otherwise n = 8 per group. **P ≤ .01 compared to WT non‐tumour area
