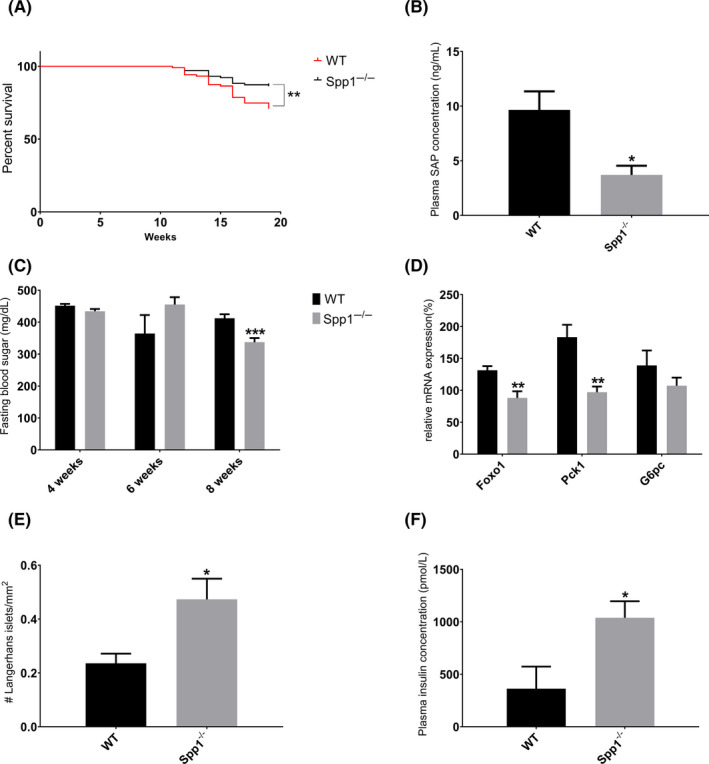
FIGURE 8.

Spp1−/− mice show a healthier overall metabolic homeostasis and an improved survival rate despite worse steatotic and fibrotic liver manifestations. A, Kaplan‐Meyer curve showing survival of WT (red full line) and Spp1 −/− (black full line) mice. B, Serum amyloid P (SAP) concentration in the plasma of 8‐week‐old NASH‐HCC mice. C, Fasting blood sugar (FBS) measured during the experimental week 4, 6 and 8. Black bars represent WT, while grey bars Spp1−/− animals. D, Gene expression analysis of the main genes regulating hepatic gluconeogenesis. E, Amount of intact pancreatic Langerhans islets, manually counted on H&E‐stained, scanned sections. F, Enzymatic assessment of plasma insulin levels. *P ≤ .05, **P ≤ .01, *** P ≤ .001. n = 15 for metabolic assessments, n = 8 for molecular analyses. See also Figure S3
