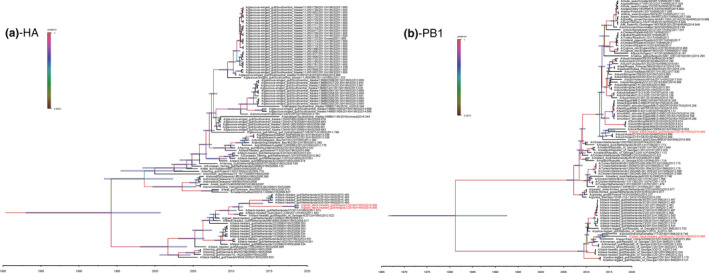
Figure 2.

Maximum clade credibility trees of the coding sequences of eight segments. Node bars indicate 95% highest posterior density (HPD) of the node height. The two H16N3 viruses isolated in this study are coloured in red. Each branch was coloured by posterior probability. The segments shown are (a) HA, (b) NA, (c) PB2, (d) PB1, (e) PA, (f) NP, (g) M and (h) NS [Colour figure can be viewed at wileyonlinelibrary.com]
