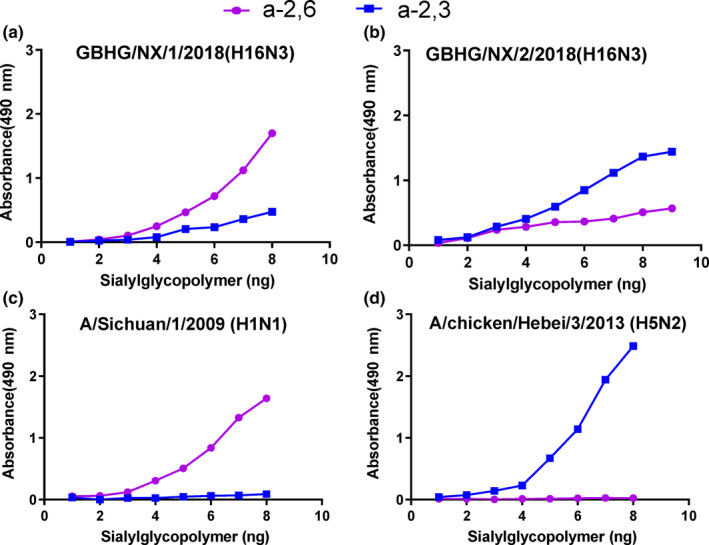
Figure 4.

Characterization of the receptor‐binding properties of H16N3 viruses. The binding of the viruses to two different biotinylated glycans (α‐2,3 glycan, blue; α‐2,6 glycan, pink) was tested. The data shown are the means of three repeats; the error bars indicate the standard deviations. (a) GBHG/NX/1/2018(H16N3), (b) GBHG/NX/2/2018(H16N3), (c) A/chicken/Hebei/3/2013(H5N2) and (d) A/Sichuan/1/2009(H1N1) [Colour figure can be viewed at wileyonlinelibrary.com]
