Figure 6.

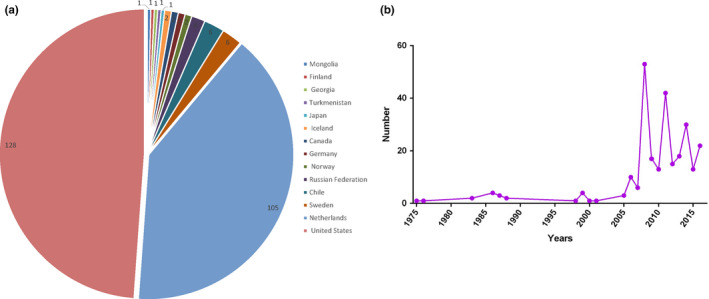
Pie chart showing all H16 viruses that have been isolated worldwide since 1975 (a) and a line chart showing the number of H16 virus isolates obtained per year (b) [Colour figure can be viewed at wileyonlinelibrary.com]

Pie chart showing all H16 viruses that have been isolated worldwide since 1975 (a) and a line chart showing the number of H16 virus isolates obtained per year (b) [Colour figure can be viewed at wileyonlinelibrary.com]