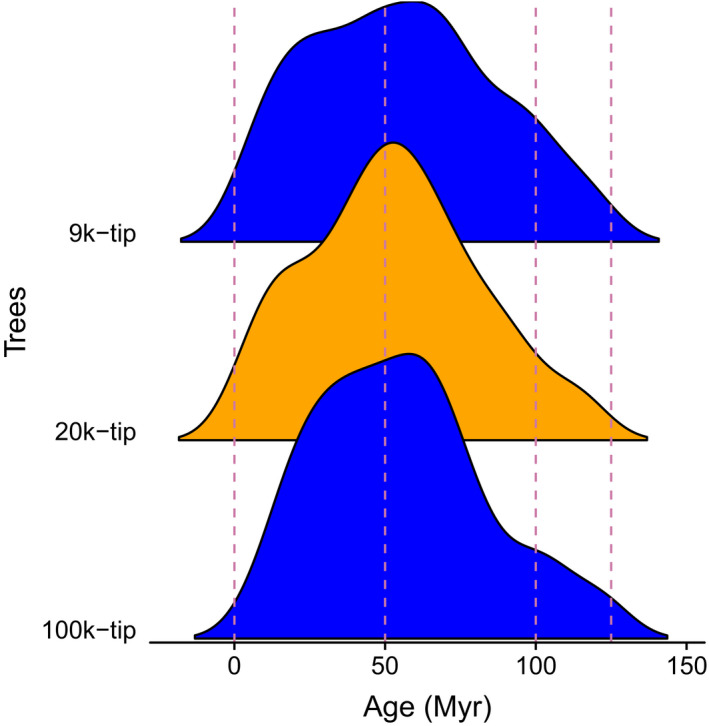
Figure 2.

Age distribution of crown ages for rosid clades extracted from the 9k‐, 20k‐, and 100k‐tip trees. The dating method used is treePL. The 9k‐tip and 100k‐tip trees are shown in blue, and 20k‐tip tree is in orange. For the dated treePL trees used in this study, the probability density distributions of clade dates were very similar across very different sampling levels.
