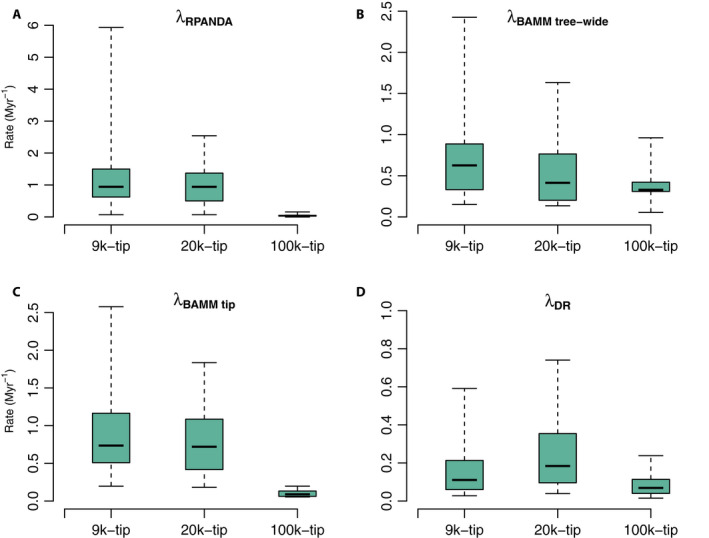
Figure 3.

Tip speciation rate box plots across the three empirical data sets (i.e., 9k‐tip, 20k‐tip, and 100k‐tip trees). Panels A–D correspond to contemporary speciation rates (λ) estimated by RPANDA (λRPANDA), BAMM (speciation rate: λBAMM tree‐wide; and tip rate: λBAMM tip), and DR (λDR), respectively. The boxes and whiskers represent the 0.25–0.75 and the 0.05–0.95 quantile ranges.
