
Figure 5.
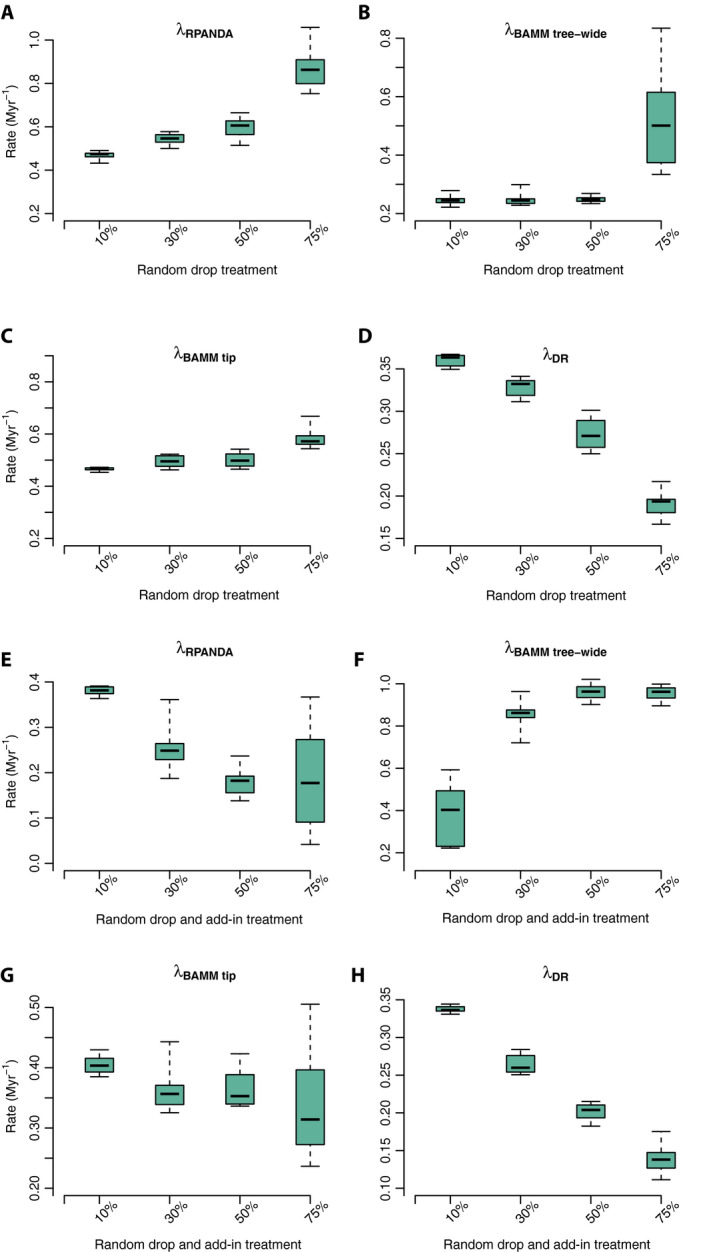
Sampling simulation box plots with four treatments and three different rate metrics using the Cucurbitaceae tree. Contemporary speciation rates (λ) estimated by RPANDA (λRPANDA), BAMM (speciation rate: λBAMM tree‐wide; and tip rate: λBAMM tip), and DR (λDR). Panels A–D correspond to the random sampling simulations; panels E–H correspond to the random sampling simulations with backbone‐addition following similar labeling conventions to A–D.