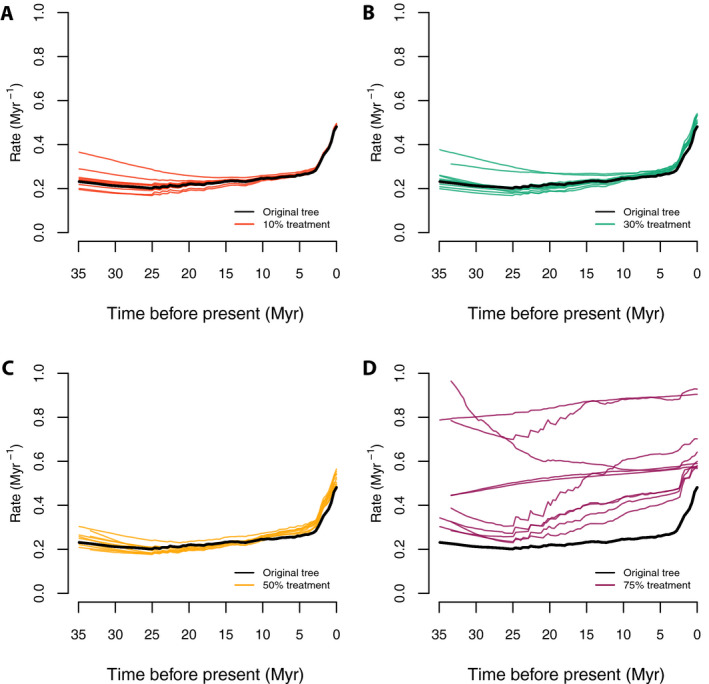
Figure 6.

Speciation rate‐through‐time plots with the random sampling simulations. Panels A–D correspond to the color‐coded rate‐through‐time curves generated by 10 random trees each, under 10%, 30%, 50%, and 75% of taxa randomly dropped, respectively; the thick black lines stand for the original Cucurbitaceae 528‐tip tree. The results for all sampling treatments were similar to the full empirical sampling result except for the most extreme experiment (75% of tips dropped).
