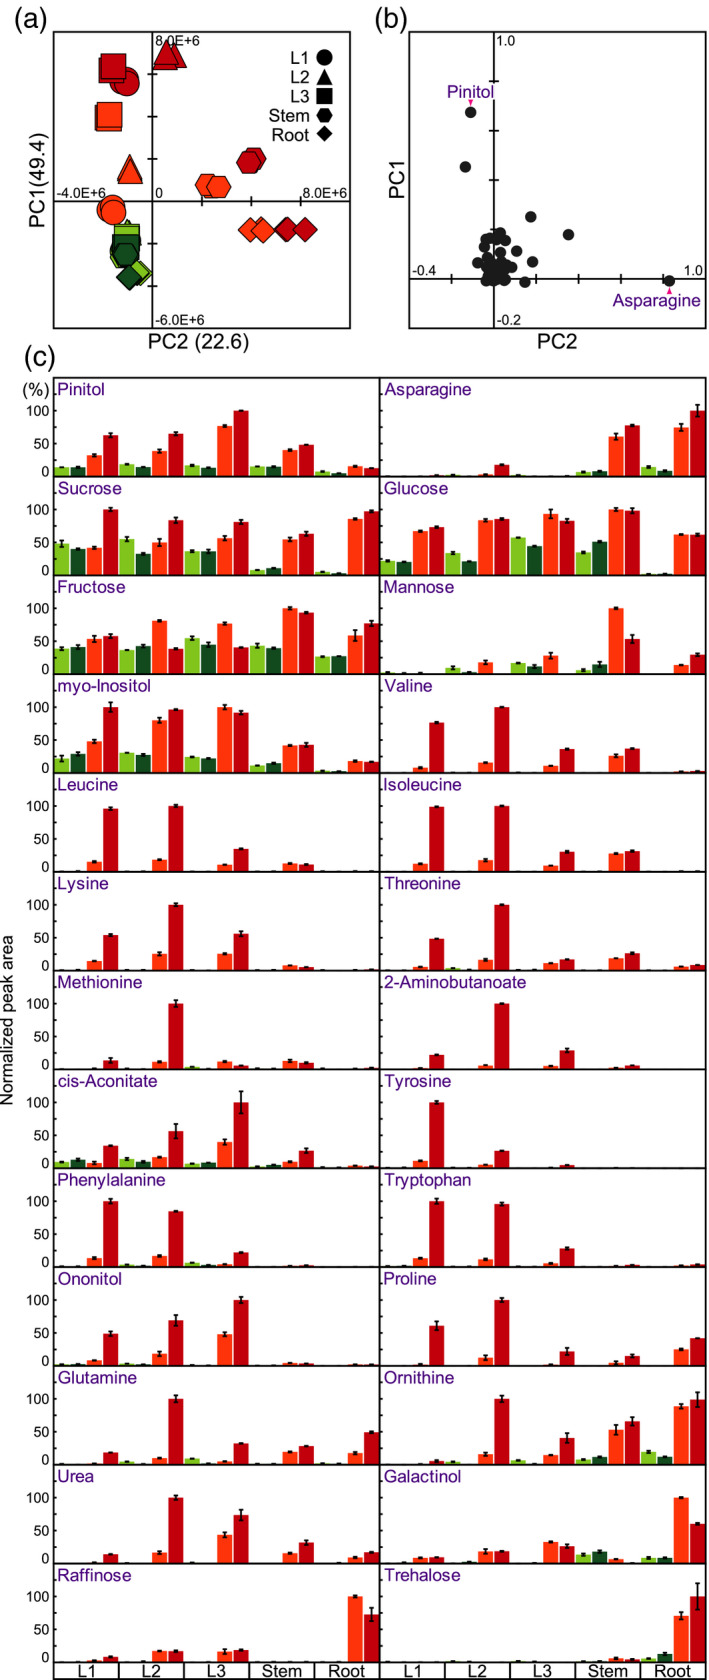
Figure 2.

Statistical analysis of the metabolite profiles of soybean organs (1st [L1], 2nd [L2], and 3rd [L3] trifoliate leaves; stems [S]; and roots [R]) after exposure to dehydration. Metabolite levels were measured in various soybean organs subjected to four treatments: dehydration (water withheld) for 3 days (D3) or 4 days (D4) and untreated for 3 or 4 days (U3 and U4, respectively). (a) Principal component analysis (PCA) of metabolite levels. Values on the y and x axes indicate PC1 and PC2, respectively. (b) PCA loadings for metabolites. (c) Representative metabolites under water‐deficit stress conditions. In each case, the maximum level of metabolite was set to 100. Values are means (n = 3 experiments); error bars show SDs.
