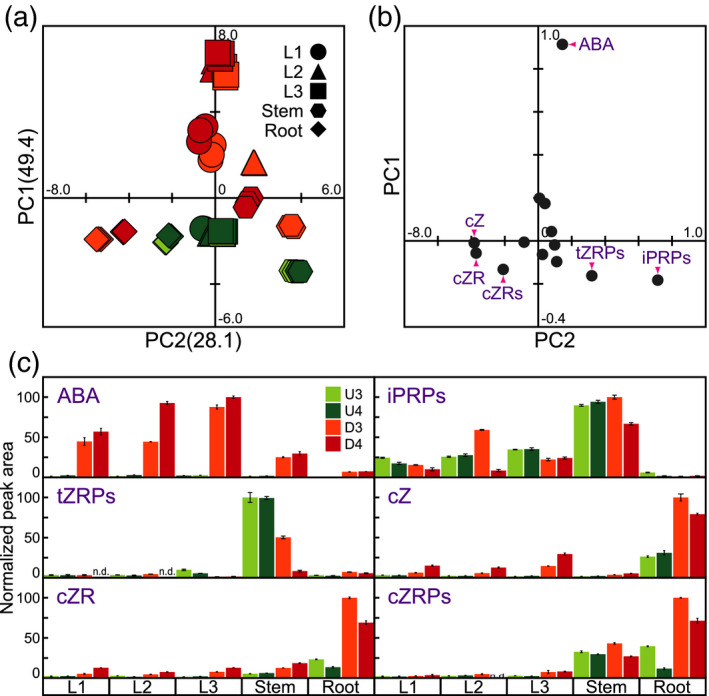
Figure 3.

Statistical analysis of the phytohormone profiles of soybean organs after exposure to dehydration. Phytohormone levels were measured in various soybean organs subjected to four treatments: U3, U4, D3, and D4. (a) Principal component analysis (PCA) of phytohormones. Values on the y and x axes indicate PC1 and PC2, respectively. (b) PCA loadings for phytohormones. (c) Relative levels of representative phytohormones. n.d. indicates that the phytohormone could not be detected. In each case, the maximum phytohormone level was set to 100. Values are the mean ± SD (n = 3 experiments). ABA, abscisic acid; iPRPs, N 6‐(Δ2‐isopentenyl) adenine ribosides; tZRPs, trans‐zeatin riboside‐5′‐phosphates; cZ, cis‐zeatin; cZR, cis‐zeatin riboside; cZRPs, cis‐zeatin 5′‐phosphates.
