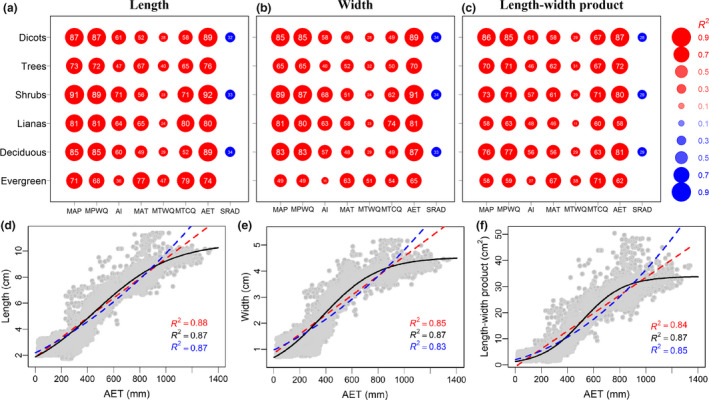
Figure 1.

The explanatory power of environmental variables on the geographical patterns of leaf size (a–c) and the relationship between leaf size and annual evapotranspiration (d–f) in China. From left to right, the three columns represent leaf length, leaf width and leaf length‐width product (with a correction factor of 2/3). In (a), (b) and (c) each dot represents a relationship between an environmental factor and a leaf size measure evaluated with logistic regression. The sizes of the dots together with the numbers on them represent R 2 (expressed as percentages, %); red and blue colours represent positive and negative correlations respectively. The P values of all the regressions were evaluated with a modified t‐test (Dutilleul et al. 1993), and only dots with P values < 0.001 were included because of the multiple pairwise tests of leaf size–climate correlations (α = 0.05/48). Corresponding full scatter plots are presented in Figures S1.6–S1.8 and for the corresponding R 2 and P values of those relationships are presented in Table S1.5. Note: in (a), (b) and (c) the relationships between leaf length, leaf width and leaf length‐width product, respectively, with from left to right mean annual precipitation (MAP, mm), precipitation of wettest quarter (MPWQ, mm), aridity index (AI, mm), mean annual temperature (MAT, °C), mean temperature of warmest quarter (MTWQ, °C), mean temperature of coldest quarter (MTCQ, °C), annual actual evapotranspiration (AET, mm) and annual solar radiation (SRAD, kJ cm−2 day−1) are given from top down for all woody dicots, trees, shrubs, woody lianas, deciduous dicots and evergreen dicots). In (d), (e) and (f) logistic (black solid lines) and linear (red‐dashed lines) regressions are shown together with corresponding R‐values. The vertical axis represents average leaf length (d), leaf width (e) and length‐width product (f) of all woody dicots, and the horizontal axis represents AET.
