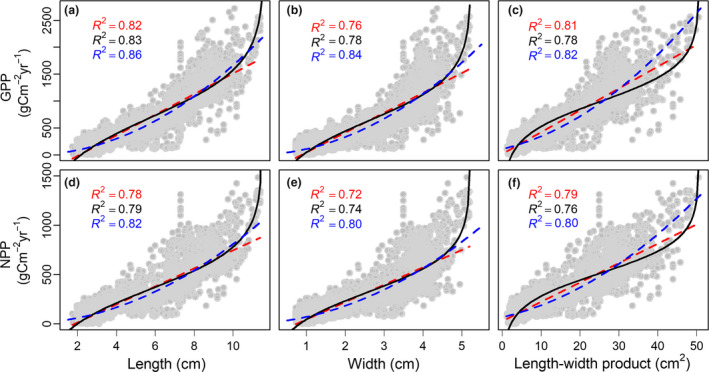
Figure 2.

Variation in primary productivity in relation to leaf size in China. From left to right, the three columns represent average leaf length (cm), leaf width (cm) and leaf length‐width product (cm2) of woody dicots. The first and second rows represent gross primary productivity (GPP, gC m−2year−1) and net primary productivity (NPP, gC m−2year−1) respectively. GPP and NPP were estimated from a widely used MODIS product (See Methods for more detail). The regression lines and R 2 values were estimated with both logistic (black lines and numbers for the logistic function y = 1/r × (a‐ln(K/x‐1)) and two linear regressions (blue lines and numbers of the function sqrt(y) = a + b × x and red dashed lines and numbers for the function y = a + b × x). Note that only when leaf size values are less than the estimated can logistic regressions be used to predict GPP and NPP
