
Figure 1.
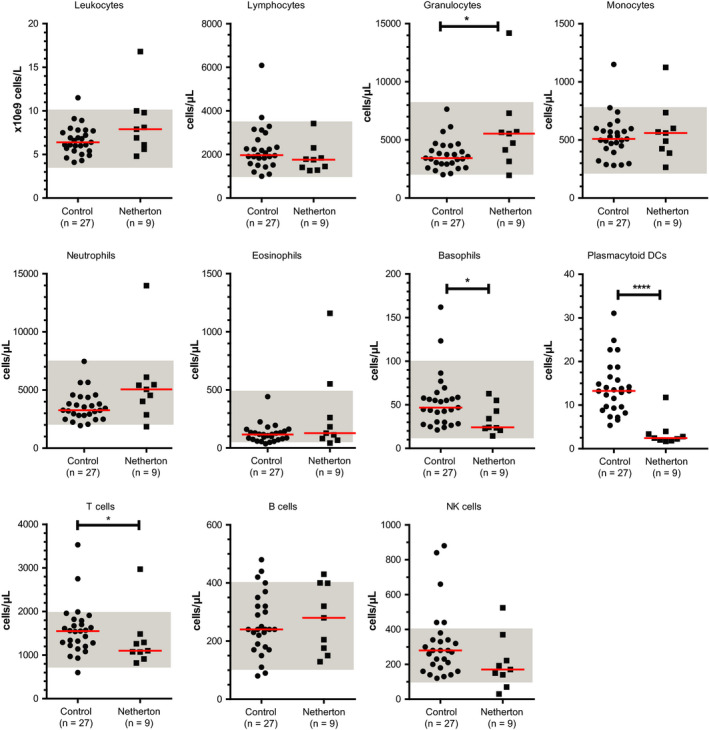
Absolute numbers of leukocytes and leukocyte subsets in healthy individuals and in adult patients with NS. Each symbol represents an individual with red lines indicating median values. Normal ranges are depicted in gray shades. Statistics, Mann‐Whitney U test; *P < .05; ****P < .0001 (n = 3)