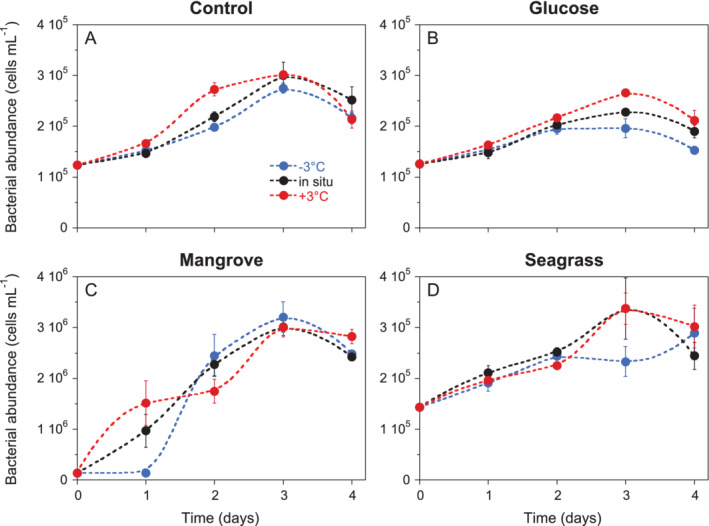
Figure 1.

Dynamics of mean total [sum of low (LNA) and high (HNA) nucleic acid content bacteria] bacterial abundance during the 4 days incubations in the (A) Control, (B) Glucose, (C) Mangrove and (D) Seagrass treatments. Error bars represent standard deviations of 3 replicates. Dashed smooth fitting joins treatment points for clarity. Specific growth rate calculations included at least 3 sampling points (i.e. from day 0 to day 2) except in the Mangrove treatment at in situ and +3°C temperatures. Control at −3°C and in situ and Seagrass at in situ and +3°C temperatures included also day 3 while Seagrass at −3°C included the 4 days.
