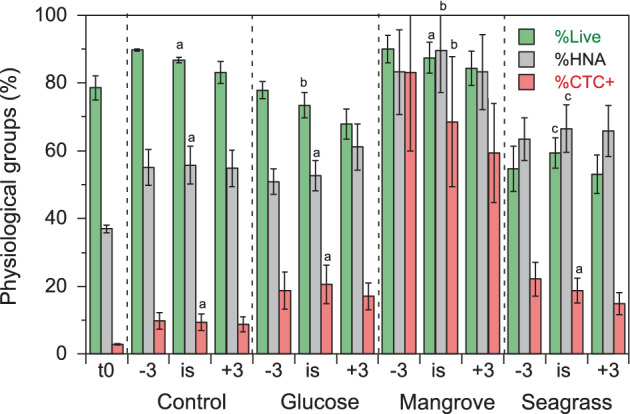
Figure 2.

Mean percent contributions of Live, HNA and CTC+ bacteria in the different DOM and temperature treatments (n = 12) plus at the beginning of the experiments (t0, n = 3). −3, 3°C below in situ temperature; is, in situ temperature; +3, 3°C above in situ temperature. Different letters represent significant differences between DOM treatments at in situ temperature (ANOVA, P < 0.05, Tukey–Kramer HSD). Error bars represent standard deviations.
