Figure 3.

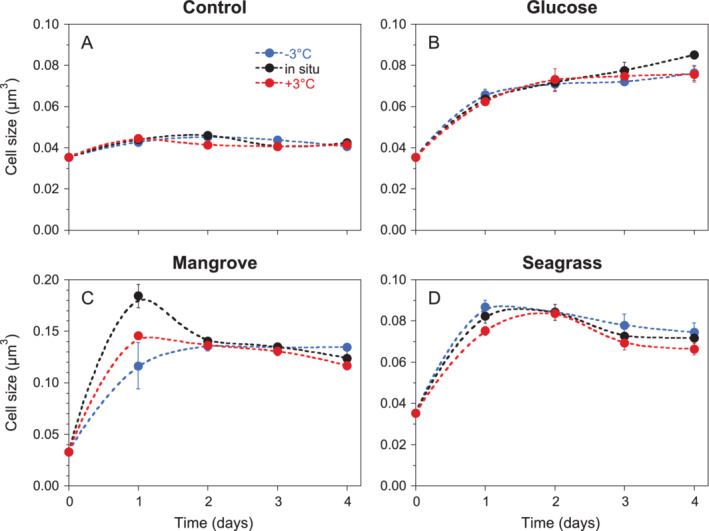
Dynamics of mean bacterial cell size during the 4 days incubations in the (A) Control, (B) Glucose, (C) Mangrove and (D) Seagrass treatments. Error bars and dashed lines are shown as in Fig. 1. Notice the different Y‐axis scale in C.

Dynamics of mean bacterial cell size during the 4 days incubations in the (A) Control, (B) Glucose, (C) Mangrove and (D) Seagrass treatments. Error bars and dashed lines are shown as in Fig. 1. Notice the different Y‐axis scale in C.