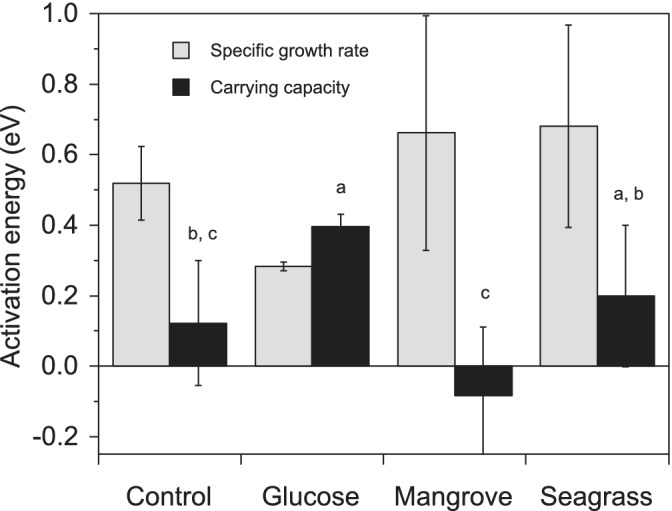
Figure 4.

Activation energies of the specific growth rates and carrying capacities of the total bacterial community (sum of LNA and HNA cells). Error bars represent standard errors of the estimates. Different letters represent significant differences between DOM treatments (ANOVA, P < 0.05, Tukey–Kramer HSD).
