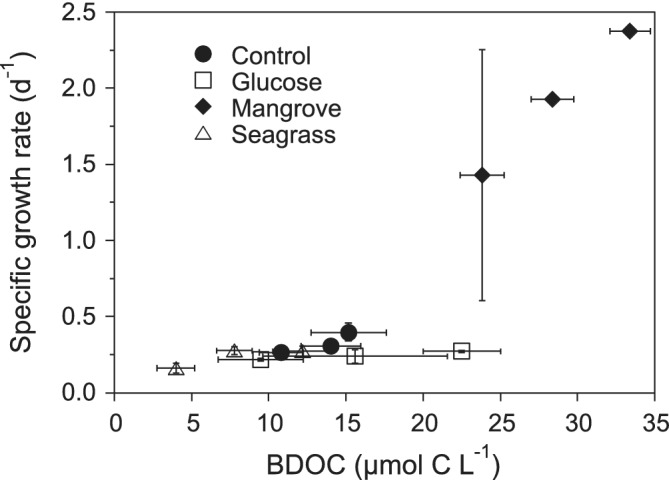
Figure 5.

Scatterplot of the mean specific growth rates of the total bacterial community versus BDOC in the different DOM treatments and temperatures. Increasing BDOC values within each treatment match exactly increasing incubation temperatures. Error bars represent standard errors of three replicates.
