Fig. 9.

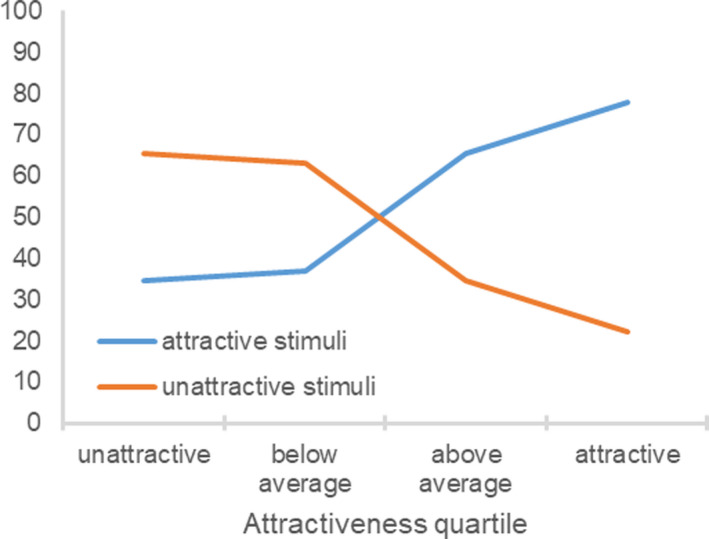
Selection (in percentage) of attractive and unattractive comparisons as a function of the participant’s objective attractiveness (Study 6). [Colour figure can be viewed at wileyonlinelibrary.com]

Selection (in percentage) of attractive and unattractive comparisons as a function of the participant’s objective attractiveness (Study 6). [Colour figure can be viewed at wileyonlinelibrary.com]