
. 2020 May 8;61(5):951–958. doi: 10.1111/epi.16507
© 2020 Cleveland Clinic. Epilepsia published by Wiley Periodicals, Inc. on behalf of International League Against Epilepsy
This is an open access article under the terms of the http://creativecommons.org/licenses/by-nc-nd/4.0/ License, which permits use and distribution in any medium, provided the original work is properly cited, the use is non‐commercial and no modifications or adaptations are made.
FIGURE 3.
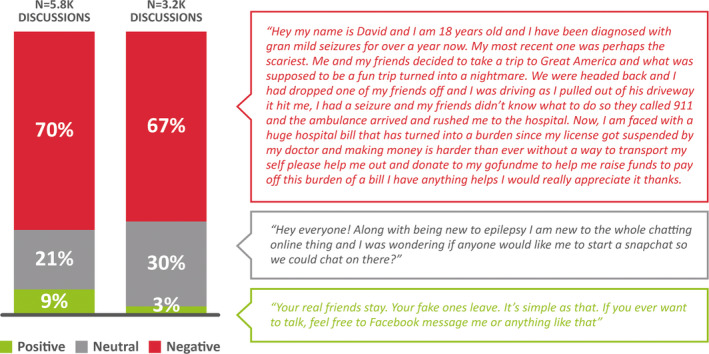
Distribution of various drivers of conversation in teenagers and adults