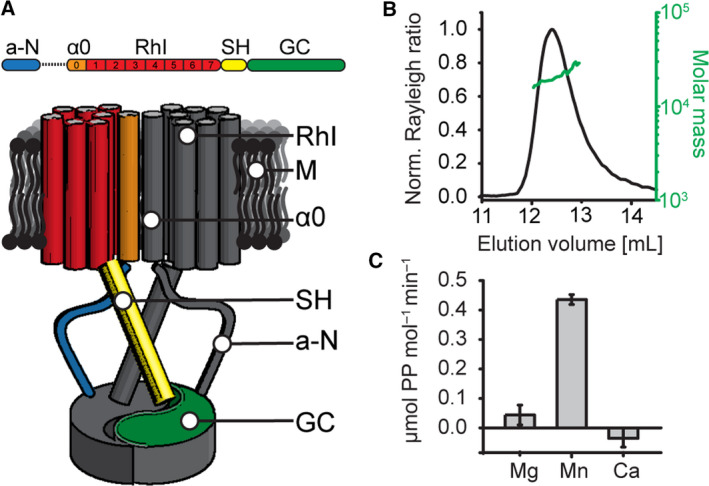
Figure 1.

Characterization of the crystallized construct. (A) Schematic domain organization of the full‐length RhGC (top) and its potential dimeric assembly (bottom). M: membrane. From the N terminus: a‐N: N‐terminal autoinhibitory region. α0: predicted additional transmembrane helix. RhI: type I rhodopsin domain. SH: signalling helix. GC: GC domain. On the bottom panel, one of the monomers is colour‐coded, whereas the second one is shown in grey. (B) SEC‐MALS analysis of the CaGC construct. The chromatogram displays normalized Rayleigh ratio (black) and molar mass calculated by MALS (20 kDa, green). (C) Activity of the CaGC construct in solution in the presence of different divalent cations measured as concentration of generated pyrophosphate. Activity was measured in triplicates. Depicted values represent the mean ± SD.
