
Fig. 1.
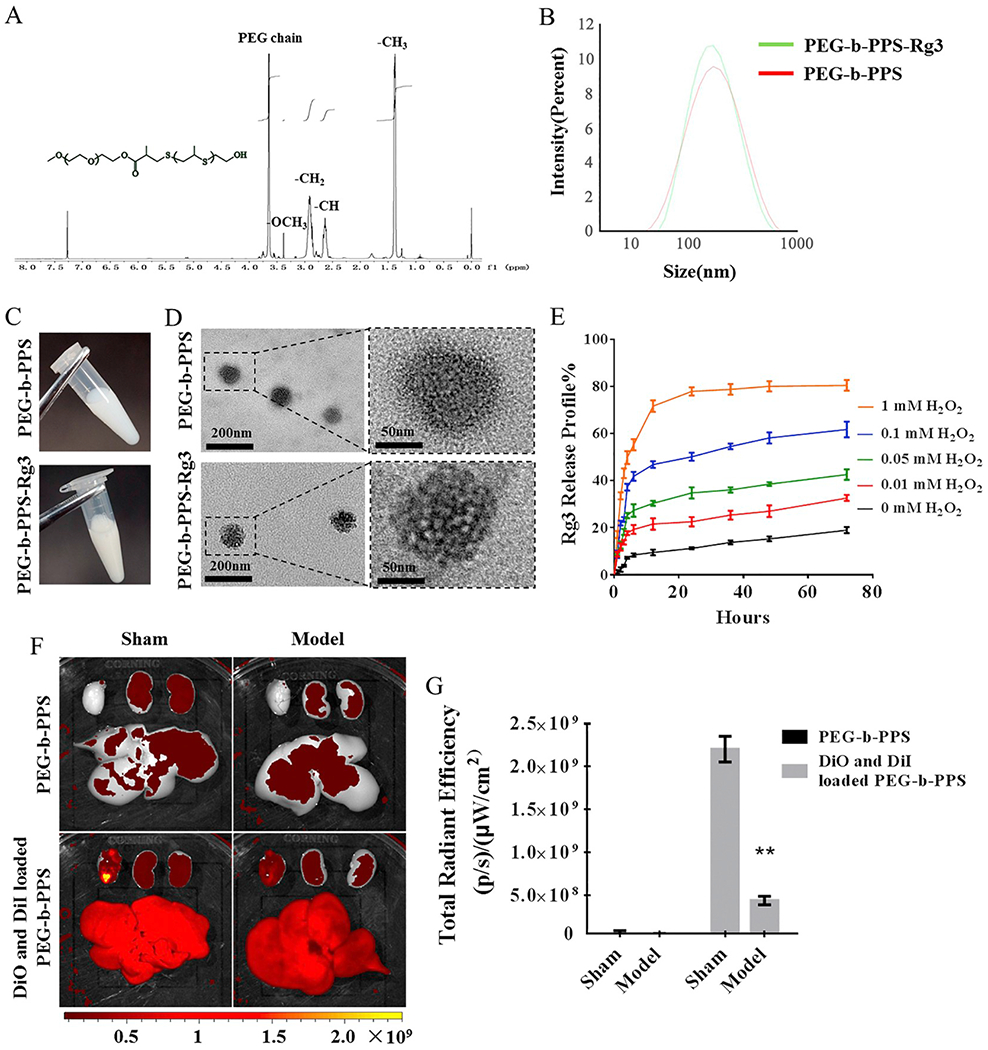
Characterization and release profile of PEG-b-PPS-Rg3 nanoparticles. (A) 1H NMR spectrum of PEG-b-PPS. 1H NMR (CDC13): δ = 1.30–1.40 ppm (−CH3 in PPS chain), 2.6–2.7 ppm (-CH in PPS chain), 2.80–3.0 ppm (−CH2 in PPS chain), 3.25–3.35 ppm (−OCH3), 3.5–3.75 ppm (PEG chain protons). (B) Size distribution of PEG-b-PPS and PEG-b-PPS-Rg3 as determined by DLS. (C) Appearance of PEG-b-PPS and PEG-b-PPS-Rg3. (D) TEM image showing the morphology of PEG-b-PPS and PEG-b-PPS-Rg3. (left: scale bar = 200 nm; right: scale bar = 50 nm). (E) Release profiles of PEG-b-PPS-Rg3 in the presence of 0, 0.01, 0.05, 0.1, and 1 mM H2O2 (n = 3 per group). (F) Representative FRET images of DiO and DiI co-loaded PEG-b-PPS release in rat hearts. (G) Total radiant efficiency according to FRET in the sham and model groups (n = 3 per group). Data are presented as means ± SD, **p < .01 compared with the sham group.