
Fig. 4.
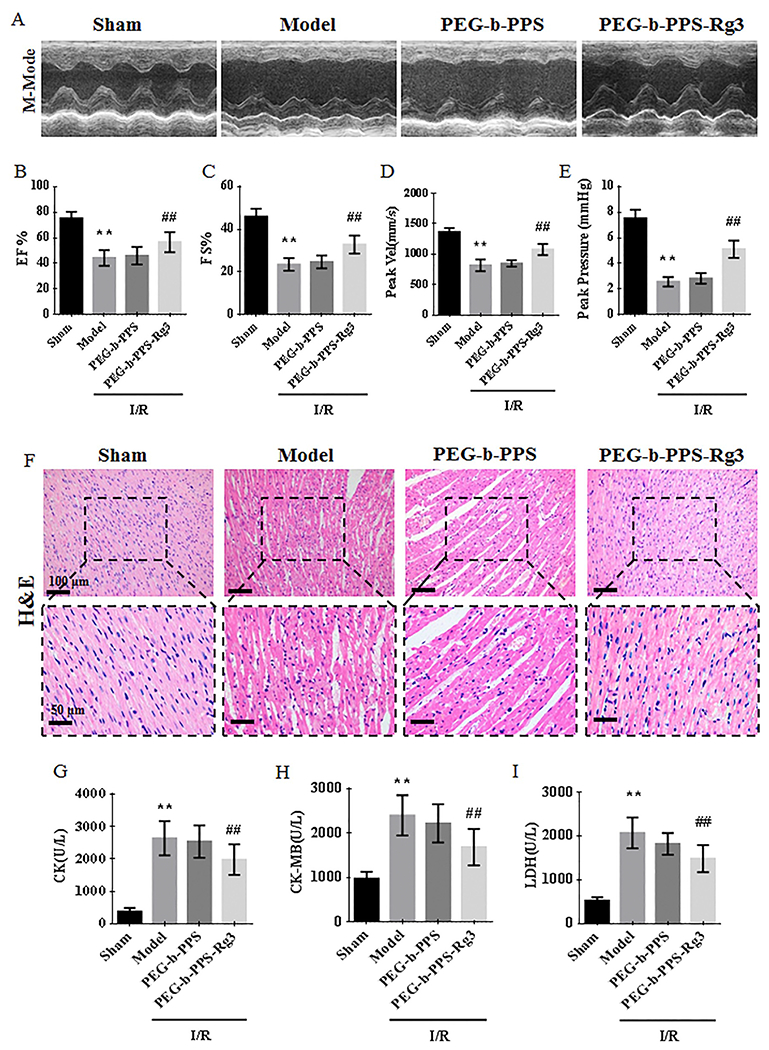
PEG-b-PPS-Rg3 nanoparticles improve cardiac functions against MIRI. (A) Representative M-mode echocardiograms for each group. (B-E) Quantification of EF %, FS%, Peak Vel, and peak pressure (n = 6 per group). (F) Representative H&E staining of heart transverse sections (scale bar = top, 100 pm; bottom, 50 pm). (G-I) Levels of CK, CK-MB, and LDH in rat serum (n = 6 per group). Data are presented as means ± SD, **p < .01 compared with the sham group; ##p < .01 compared with the model group.