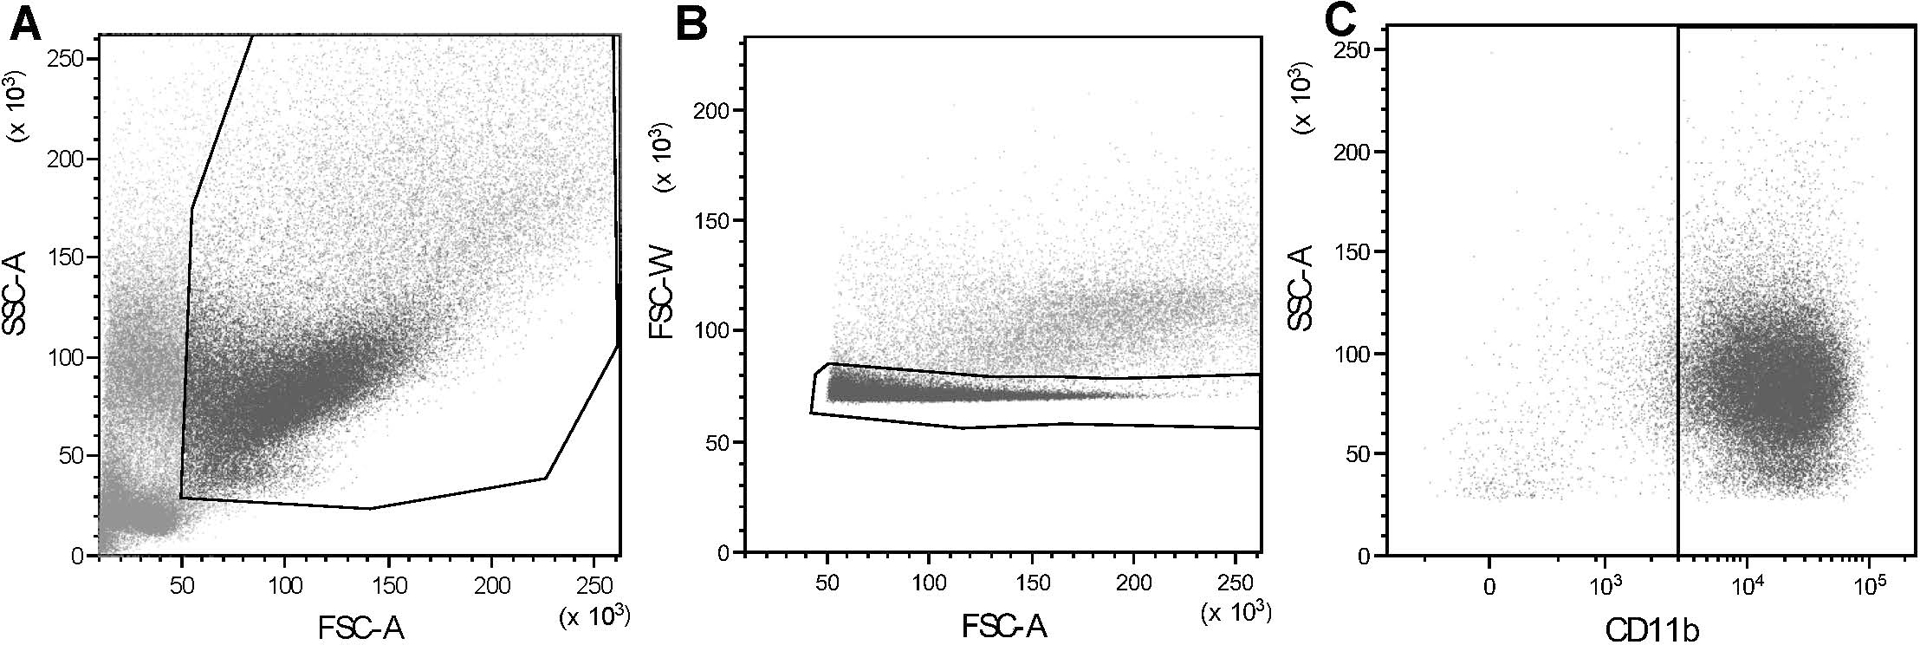
Figure 3: Gating strategies for macrophage flow cytometry.

Representative dot plot showing canine macrophage gating using (A) typical forward and side scatter characteristics; (B) gating in of singlet cells (noted within the outlined area) to exclude doublets; (C) gating of CD11b+ macrophages (noted in the gate on the right side of the plot). Human macrophage gating (not shown here) was performed in similar fashion. The average percentages of macrophages of all the cells (including viable and non-viable) present prior to the application of gating strategies were as follows: canine macrophages 20.35%, human macrophages 20.82%. The average percentages of macrophages of the viable cells present after application of gating strategies were as follows: canine macrophages 93.24%, human macrophages 84.96%.
