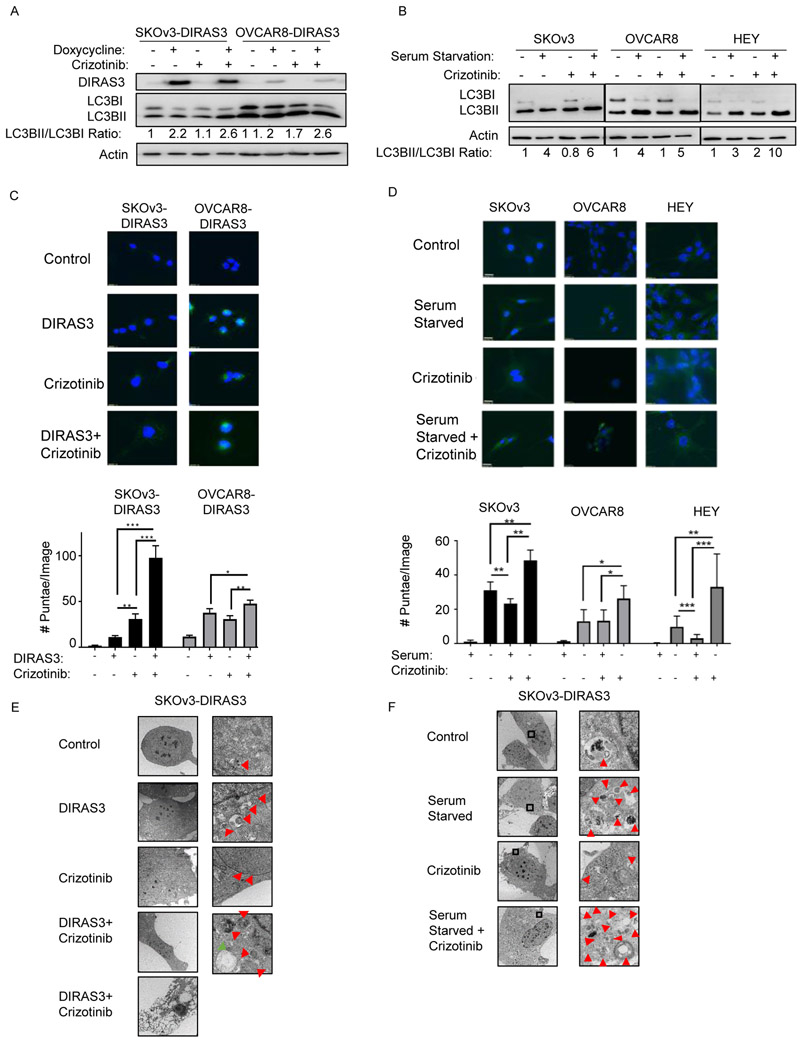
Figure 3. Crizotinib further increases autophagy.
A-B. SKOv3-DIRAS3 and OVCAR8-DIRAS3 cells were treated with +/− doxycycline (A), and SKOv3, OVCAR8, and HEY cells were serum-starved (B) during treatment with crizotinib for 72 hrs before western blot analysis of MAP-LC3 conversion. C-D. Effect of crizotinib on autophagy induced by DIRAS3 (C) or serum starvation (D). Cells treated as described in A and B were fixed and stained for LC3B by immunofluorescence. Quantification of LC3B punctae are graphed below. All experiments were repeated in triplicate and subjected to ANOVA analysis. * p<0.05, ** p<0.01, *** p<0.005, **** p<0.001. Autophagy was further visualized with transmission electron microscopy in E. ± DIRAS3 ± crizotinib treated SKOv3-DIRAS3 cells and F. ± serum starved ± crizotinib treated SKOv3 cells at 2 magnifications (3000x and 5000x). Red arrows: autophagosomes, green arrow: autophagolysosomes.

