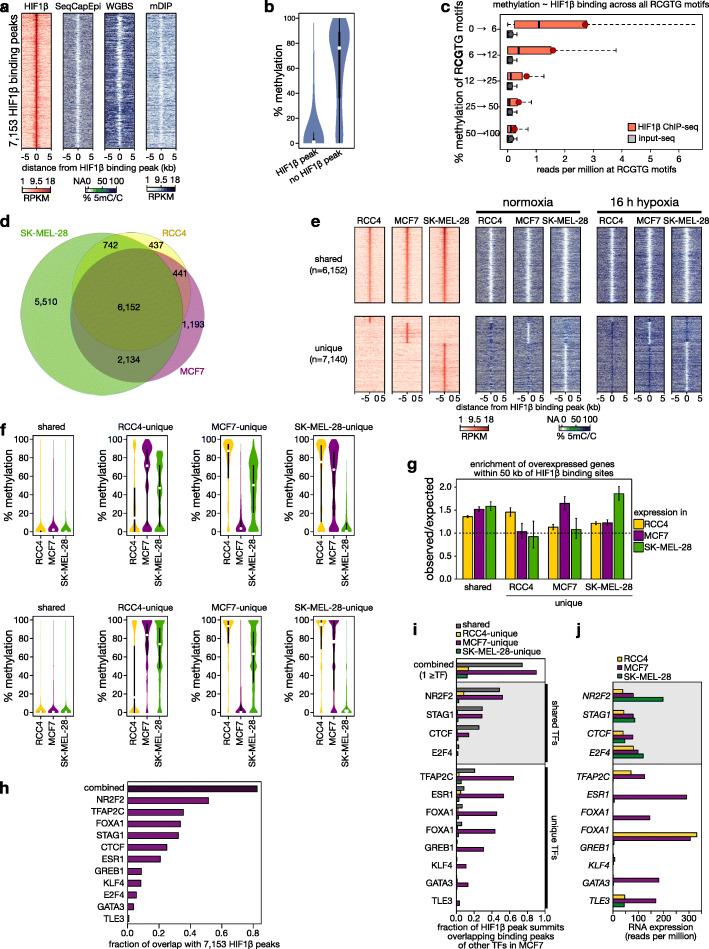
Fig. 1.
Methylation at HIF1β binding sites. a Heatmaps of HIF1β binding and DNA methylation for 7153 regions (identified using a stringent threshold of P < 10− 15 in MACS) surrounding the HIF1β ChIP-seq peak summit (± 5 kb). Heatmaps depict reads per kb per million reads (RPKM) of HIF1β ChIP-seq and of 5mC DNA IP-seq (mDIP), and % DNA methylation as estimated by SeqCapEpi BS-seq or whole-genome BS-seq (respectively, SeqCapEpi and WGBS). HIF1β binding was assessed after 16 h of 0.5% O2 (hypoxia) and DNA methylation under 21% O2 (normoxia). b Violin plots of the methylation level inside and outside HIF1β binding peaks, as estimated by SeqCapEpi BS-seq. c Sequencing read depth of HIF1β ChIP and its input, at all RCGTG sequences in MCF7 cells, stratified for methylation at the CG in the core RCGTG sequence. Shown are boxplots for all RCGTG’s in the human genome for which > 10× coverage was obtained after SeqCapEpi BS-seq, with dark red dots denoting averages. See Additional file 1: Fig. S5 for additional QC of ChIP-seq data and Additional file 2 for more details about HIF1β binding peak locations. d Venn diagram of 20,613 shared and unique HIF1β binding sites detected across 3 cell lines. Only stringent binding sites (P < 10− 15) are shown. Binding sites showing intermediate levels of HIF1β ChIP-seq enrichment in 1 or 2 cell lines are unclassified and not shown here (n = 445, 2812 and 887 peaks, detected in SK-MEL-28, RCC4, and MCF7 respectively). e Heatmaps of HIF1β binding (red) and DNA methylation as estimated using SeqCapEpi BS-seq (blue) at regions flanking the HIF1β ChIP-seq peak summit (± 5 kb). (top) HIF1β binding peaks shared between the 3 cell lines. (bottom) HIF1β binding peaks unique to each cell line. Heatmaps depict RPKM of HIF1β ChIP-seq and % DNA methylation. HIF1β binding was assessed after 16 h of 0.5% O2 (hypoxia) and DNA methylation under 21% O2 (normoxia) or after 16 h of 0.5% O2 (hypoxia). f Quantification of the methylation level at HIF1β binding peak summits ± 100 bps, for peaks that are shared between or unique to one of the 3 cell lines grown under 21% O2 (normoxia, top) or after 16 h of 0.5% O2 (hypoxia, bottom). g Enrichment of gene expression (observed/expected) upon hypoxia per cell line, for genes associated with HIF1β binding sites (within 50 kb) that are shared between or unique to one of the three cell lines, as labeled on the X-axis. h Fraction of HIF1β peaks overlapping with the binding peaks of individual transcription factors [17], or with any of the 11 transcription factors profiled in MCF7 cells (“combined”). i Overlap between HIF1β binding peaks and other transcription factor binding sites detected in MCF7 cells. Shown are fractions of HIF1β binding peaks shared between (gray) or unique for a cell line (colored). j mRNA expression level of transcription factors in each cell line, as determined using RNA-seq. Transcription factors expressed in all three cell lines are highlighted as “shared TFs” with a light gray box

