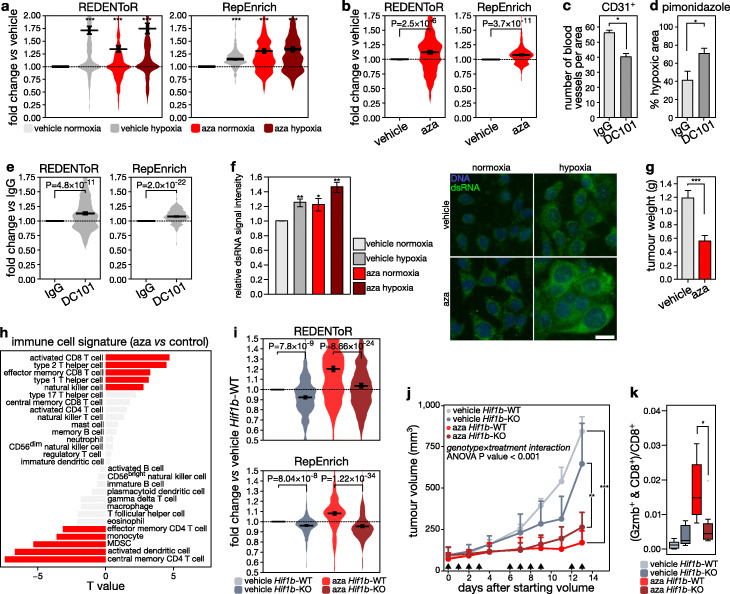
Fig. 6.
Aza treatment increases tumor immunogenicity HIF-dependently. a Expression in 4T1 cells of cryptic transcripts (CREDENToR, left) or retrotransposon subfamilies (RepEnrich, right) bound by HIF1β in hypoxic 4T1 cells, following exposure to vehicle (DMSO) or 5-aza-2′-deoxycytidine (aza; 1 μM) for 4 days, hypoxia (0.5% oxygen, 1 day) or normoxia. Difference in the distribution of expression is expressed as fold change of counts per million over control 4T1 cells. Error bars indicate geometric mean ± s.e.m. b Expression of cryptic transcripts (CREDENToR, left) or retrotransposon subfamilies (RepEnrich, right) bound by HIF1β in 4T1 cells in vehicle- and aza-treated 4T1 tumors (n = 6 per treatment condition). Difference in the distribution of expression is expressed as fold change of counts per million over control 4T1 tumors. Error bars indicate geometric mean ± s.e.m. c, d Quantification of the number of blood vessels (CD31 staining; c) and percentage of hypoxia (pimonidazole staining; d) in 4T1 tumors from mice injected with DC101 or control IgG (with at least 4 mice per treatment condition, see “Methods”). e Expression of cryptic transcripts and retrotransposon subfamilies (bound by HIF1β in 4T1 cells) as determined by CREDENToR (left) and RepEnrich (right) in control antibody- and DC101-treated 4T1 tumors (n = 6 per treatment condition). Difference in the distribution of expression is expressed as fold change of counts per million over control 4T1 tumors. Error bars indicate geometric mean ± s.e.m. f (left) Signal intensity of dsRNA staining in 4T1 cells treated with aza or PBS and incubated in hypoxia or normoxia for 24 h. (right) Immunofluorescence of dsRNA using a dsRNA antibody (clone J2, green) in 4T1 cells treated with aza or vehicle (PBS), and by a 24-h incubation in hypoxic (0.5% O2) or normoxic conditions (scale 40 μm). A representative image is shown for each condition. g Barplot showing the tumor weight of vehicle- and aza-treated 4T1 tumors (n = 6 per treatment condition). ***P < 0.001 by paired t-test. h Association between aza treatment and immune cell infiltration estimates in 4T1 tumors from mice treated with either aza or PBS, as calculated by GSVA on PanCancer immune metagenes [43] and visualized by their T value (at least 6 mice per treatment condition were sequenced). Red bars indicate significant associations (P < 0.05). i Expression of cryptic transcripts (CREDENToR, top) and retrotransposon subfamilies (RepEnrich, bottom) bound by HIF1β in 4T1 cells in 4T1 tumors WT or KO for Hif1b implanted in mice treated with vehicle or aza (see “Methods,” at least 6 tumors per treatment condition were sequenced). Difference in the distribution of expression is expressed as fold change of counts per million over Hif1b-WT vehicle-treated 4T1 tumors. Error bars indicate geometric mean ± s.e.m. j Growth of tumors generated by grafting mice orthotopically with 4T1 cells wild-type (4T1Hif1b-scr) or KO for Hif1b (4T1Hif1b-KO). Mice were treated with aza or vehicle (PBS) on the days indicated with an arrow (see “Methods”). Data represent mean and s.e.m. from independent experiments each with at least n = 6 mice per group. *P < 0.05 by t-test. A genotype-by-treatment interaction as assessed by ANOVA was P < 0.001. k Quantification of CD8+ and granzyme b (Gzmb)+ cells, depicted as percentage of CD8+ cells, from 4T1 cells WT for Hif1b (4T1Hif1b-scr) or KO for Hif1b (4T1Hif1b-KO) and treated with aza or vehicle (PBS) (n = 6 per group; see “Methods”). *P < 0.05 by t-test

