
Extended Data Fig. 9. Tumor driven deficits in T cell responses are cell-extrinsic.
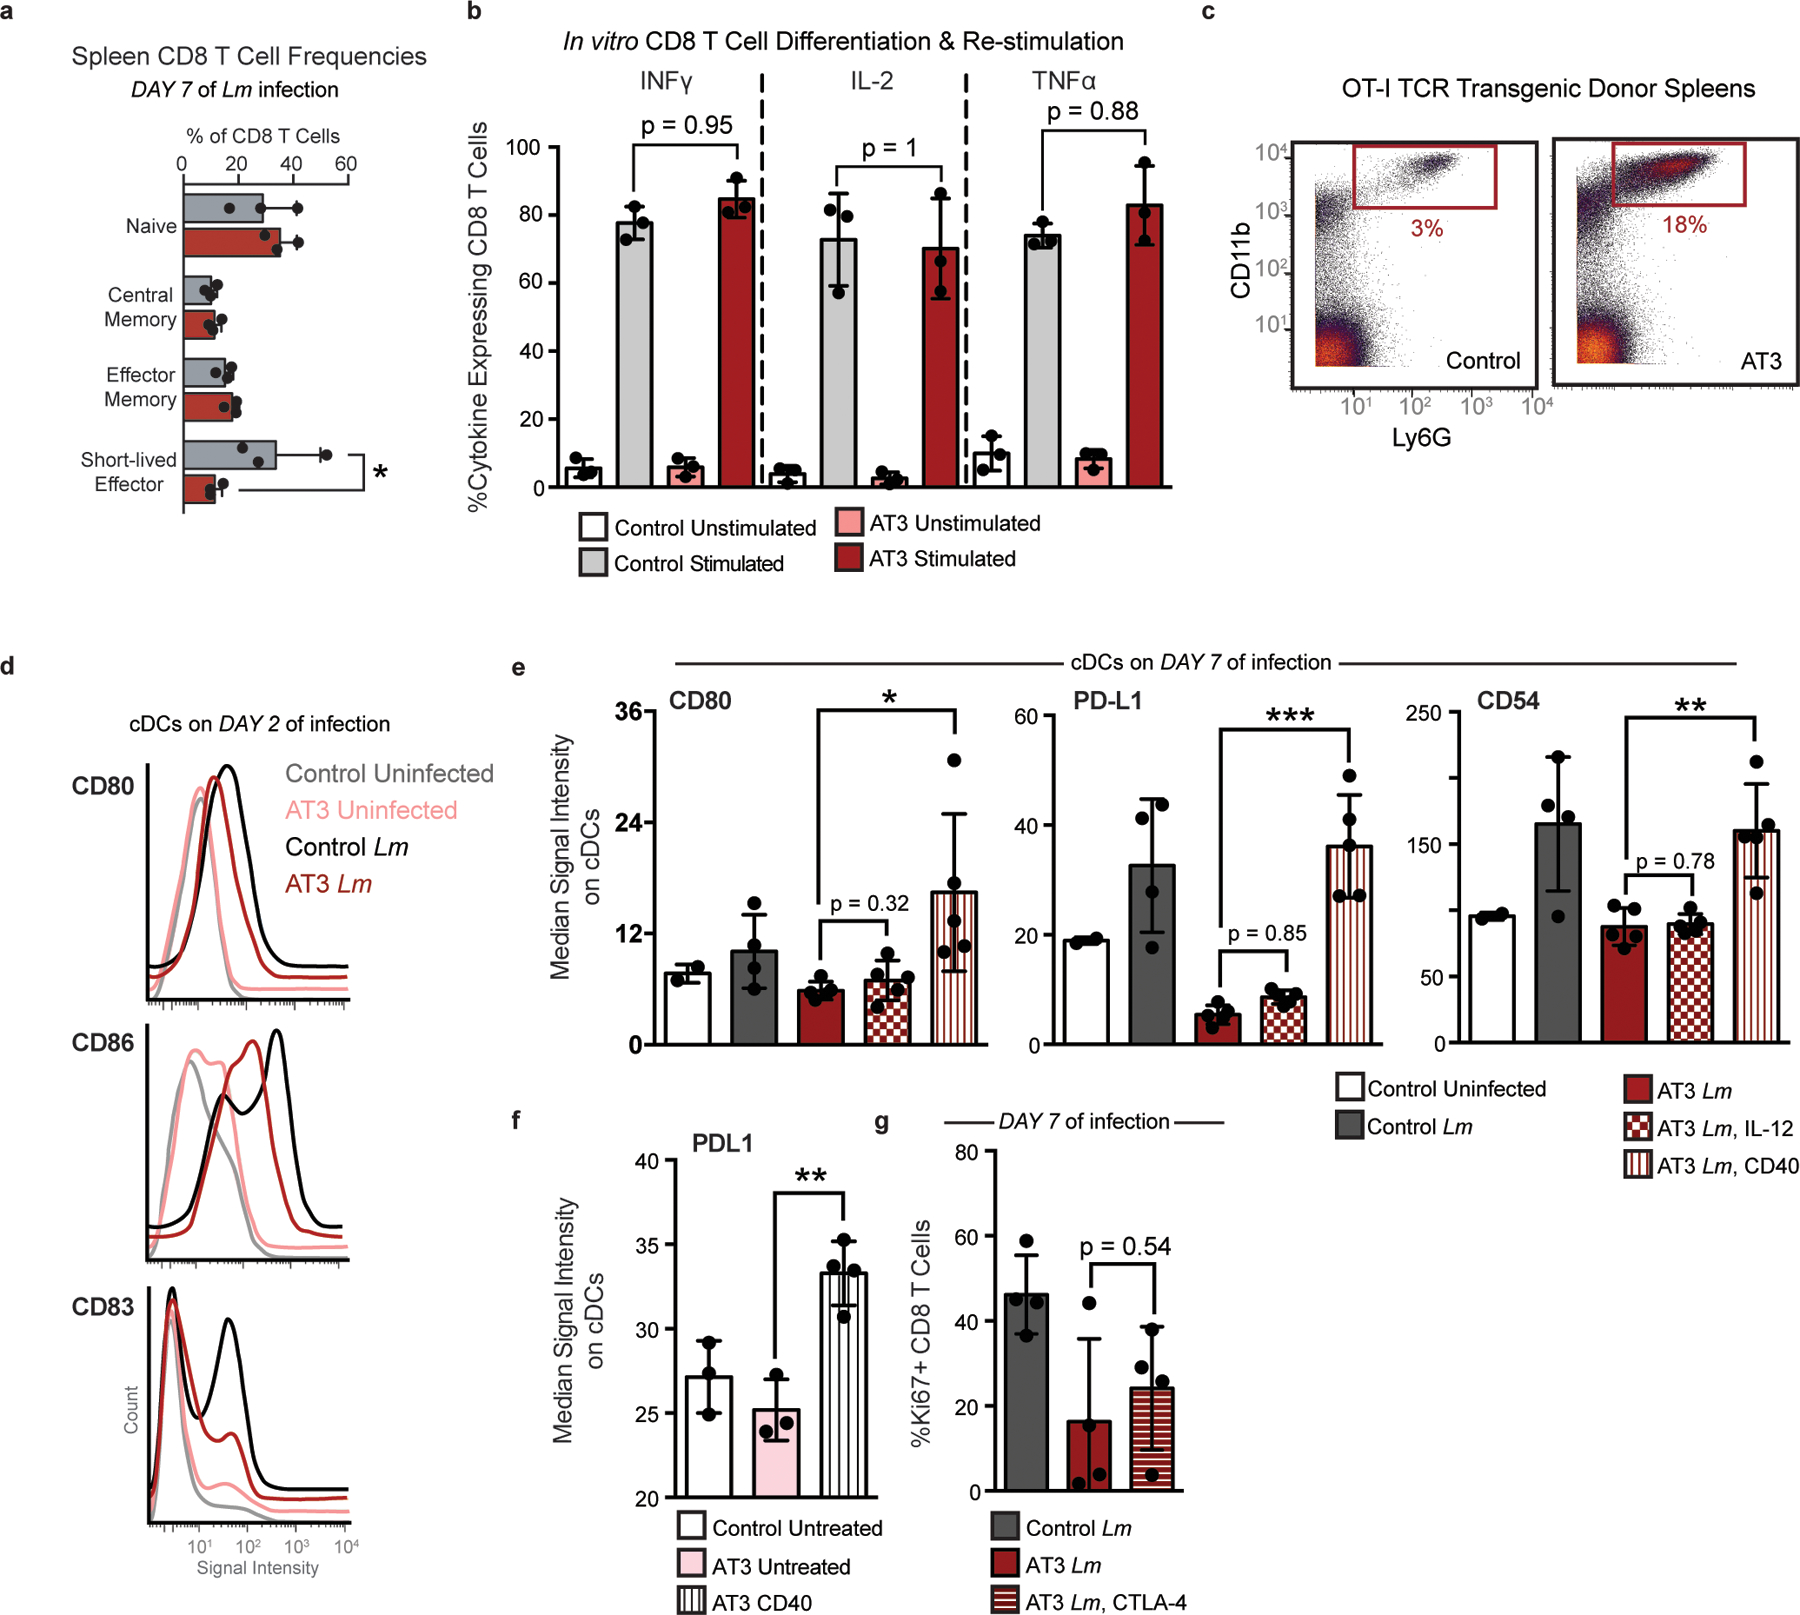
a, Quantification of bulk CD8+ T cell populations in the spleen of healthy or AT3 tumor-burdened mice after 7 days of Lm infection, Two-Way ANOVA with Bonferroni correction. b, Expression of inflammatory cytokines, INFy, IL-2, and TNFa in splenic CD8 T Cells isolated from control or AT3 tumor-burdened mice after in vitro differentiation with CD3, CD28 and IL-2, and re-stimulation with BrefeldinA and PMA Ionomycin. c, Scatter plots of CD11b and Ly6G showing expected neutrophilia in OT-I TCR transgenic mice with AT3 tumor burden. d, Histograms of CD80, CD86, and CD83 signal intensity on cDCs from healthy or AT3 tumor-burdened mice at day 2 of Lm-OVA infection. e, Median signal intensity of CD80, PD-L1 and CD54 activation markers on splenic cDCs from healthy or AT3 tumor-burdened mice compared to IL-12p70 or CD40 treatment at day 7 of Lm-OVA infection. F, Median signal intensity of PD-L1 on splenic cDCs from untreated or CD40 treated AT3 tumor-burdened (day 21) mice. G, Quantification of splenic CD8+ T cell proliferation in healthy, untreated or CTLA-4 treated AT3 tumor-burdened animals in response to 7 days of Lm-OVA infection. p*<0.05, two-tailed t-test.