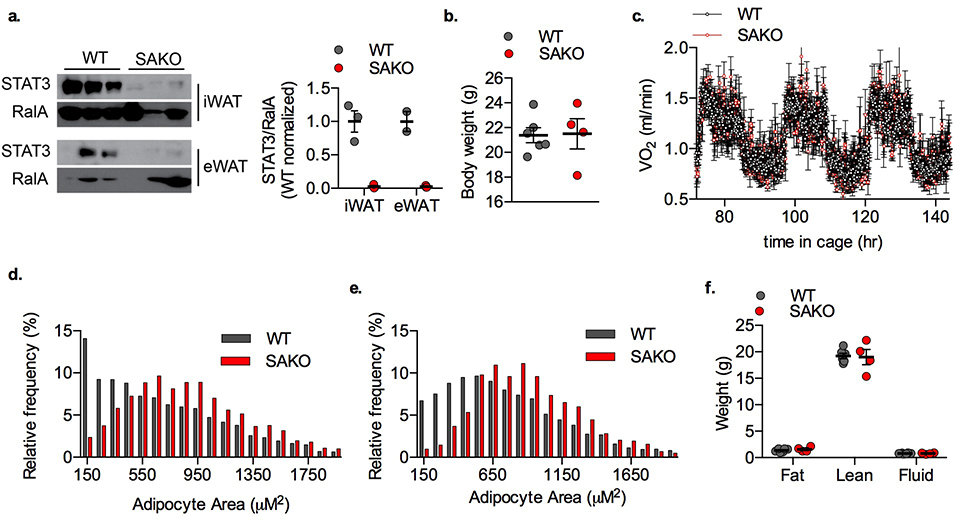
Extended Data Fig. 3: Metabolic phenotype of SAKO mice on a normal diet (ND).
a. Left panel: Western blot of mature adipocytes isolated from 12-week old WT and SAKO mice. Right panel: Quantification of STAT3 protein relative to RalA loading control. Individual data points plotted ± SEM (n = 3 iWAT, 2 eWAT). b. Body weight of 12-week old ND fed WT and SAKO mice. Individual data points plotted ± SEM (n = 6 per genotype). c. Oxygen consumption rate in ND fed WT and SAKO mice at 16-weeks of age. Data are represented as mean ± SEM (n = 16). d. Adipocyte size distribution from ND-fed 12-week old WT and SAKO eWAT (n = 2 WT and 3 SAKO). e. Adipocyte size distribution from ND-fed 12-week old WT and SAKO iWAT (n = 2 WT and 3 SAKO). f. Body composition of ND fed WT and SAKO mice at 12 weeks of age. Individual data points plotted ± SEM (n =6 WT and 4 SAKO).

