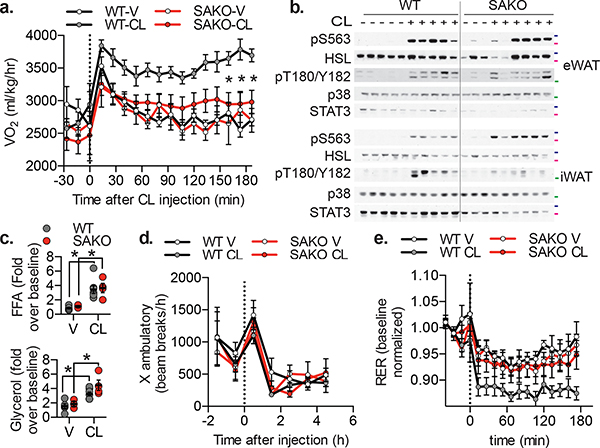
Fig. 4: Loss of adipocyte STAT3 causes a defect in oxidative metabolism in vivo.
a. Oxygen consumption in 12 week HFD-fed mice, injected with 1 mg/kg CL-316,243 or vehicle control. p values = 0.002, 0.0003, 0.002. b. Western blot analysis of 12-week HFD fed mice injected with 1 mg/kg CL-316,243 or vehicle control 20 min before sacrifice and tissue collection. 50 kDa, 75 kDa and 100 kDa protein marker locations indicated in green, pink and blue respectively, blots are representative of three independent experiments. c. Serum free fatty acid (top panel – p value = 0.006 WT and 0.028 SAKO V vs CL) and glycerol (bottom panel – p value = 0.027 WT and 0.010 SAKO V vs CL) levels in 12-week HFD fed mice injected with 1 mg/kg CL-316,243 or vehicle control for 20 min, normalized to the value in each animal prior to injection. Individual data points plotted ± SEM (n = 8 vehicle, 10 CL-316,243). d. Ambulatory activity and e. RER in 12 week HFD-fed mice, injected with 1 mg/kg CL-316,243 or vehicle control at time zero. p value < 0.0001 WT V vs. CL, and WT vs. SAKO CL. a., d. and e. Data are represented as mean ± SEM (n = 20). * p value < 0.05 from post hoc analysis after significant two-way ANOVA.

