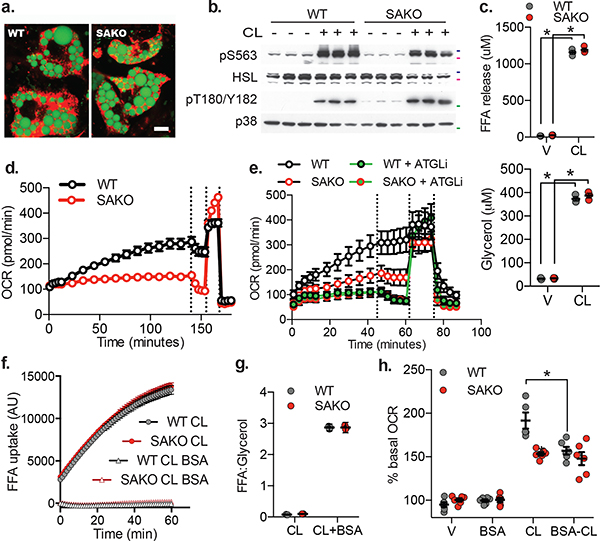
Fig. 5: Loss of adipocyte STAT3 causes a cell autonomous defect in lipolysis driven oxidative metabolism.
a. Differentiated WT and SAKO PPDIVs, results are representative of dozens of independent experiments. Lipid droplet stained with Bodipy (shown in green). Mitochondria stained with MitoTracker (shown in red). Scale bar = 10 μm. b. Western blot analysis of WT and SAKO PPDIVs treated with 1 μM CL-316,243 for 20 min, results are representative of three independent experiments. 50 kDa, 75 kDa and 100 kDa protein marker locations indicated in green, pink and blue respectively. c. FA (top panel) and glycerol (bottom panel) secreted into the media from WT and SAKO PPDIV treated with 1 μM CL-316,243 or vehicle control for 20 min. Individual data points plotted ± SEM (n = 3 per treatment per genotype, p values < 0.0001). d., e., and h. Basal oxygen consumption rate in PPDIVs. Vertical lines indicate injection times for oligomycin, FCCP and Rotenone/Antimycin A. d. Data are represented as mean ± SEM (n = 8 wells per condition). e. Atglistatin pretreated for 15 min. e. Data are represented as mean ± SEM (n = 6 wells per condition). f. FA uptake in WT and SAKO PPDIV in the presence and absence of 2% BSA. Data are represented as mean ± SEM (n = 8 wells per condition). g. Ratio of FA to glycerol released into the media from WT and SAKO PPDIV in the presence and absence of 2% BSA. Data are represented as mean ± SEM h. Assay performed in the presence and absence of 0.2% BSA in the culture media. Oxygen consumption rates after 30 min vehicle or CL-316,243 shown as a percentage of the basal OCR prior to treatment is shown. Individual data points plotted ± SEM. (n = 6 wells per condition, p value = 0.0008). * p value < 0.05 from post hoc analysis after significant two-way ANOVA.

