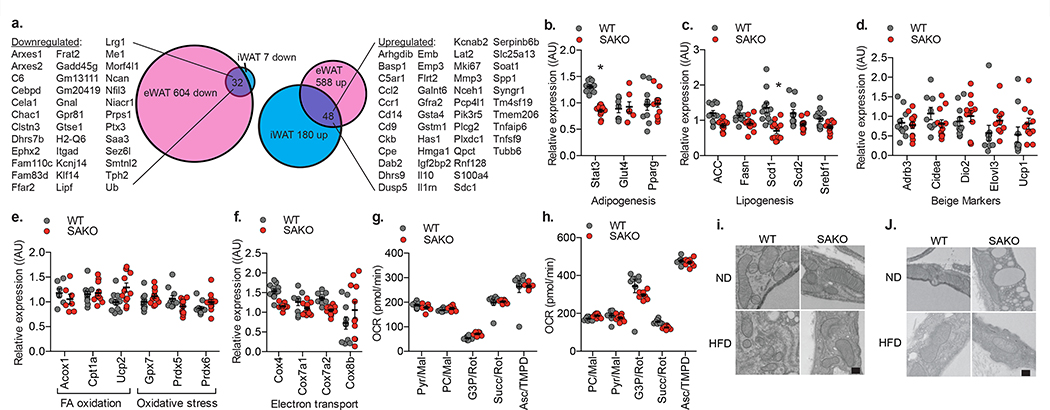
Fig. 6: The effect of STAT3 on adipocyte oxidative metabolism is non-genomic and non-mitochondrial.
a. Venn diagram showing number of differentially regulated genes in inguinal and epididymal mature adipocytes from WT and SAKO mice after 12-weeks HFD feeding (n = 3 mice per genotype). b.-f. Q-PCR analysis of gene expression in iWAT from WT and SAKO mice after 12-weeks HFD feeding. Individual data points plotted ± SEM (n = 12 mice per genotype, p value < 0.0001). g. Phosphorylating (State 3) respiration rates of oxygen consumption in mitochondria isolated from iWAT in the presence of different substrates. Individual data points plotted ± SEM (n = 8 wells per group). h. State 3 oxygen consumption rate in permeabilized PPDIV in the presence of different substrates. Individual data points plotted ± SEM (n = 8 wells per group). d.-h. No statistically significant results WT vs. SAKO. Experiments in g and h were repeated in 4 independent experiments, all with similar results; no significant difference between WT and SAKO OCR found by two-way ANOVA with post hoc analysis. Electron micrograph of iWAT (i) and eWAT (j), showing mitochondrial structure. This experiment was repeated independently with similar results. Scale bar = 200 nm. * p value < 0.05 versus WT two-sided student’s t-test.

