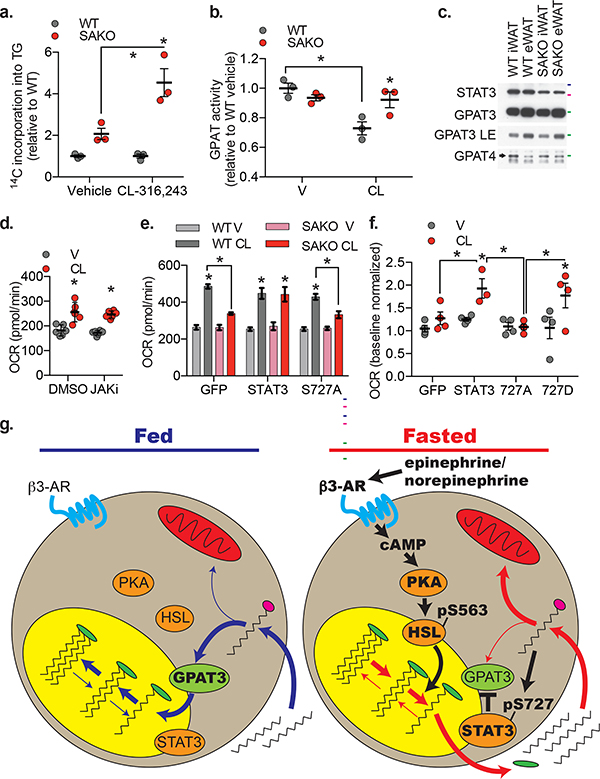
Fig. 8: Regulation of FA disposition by STAT3.
a. Incorporation of 14C-palmitic acid into triglycerides by SAKO PPDIV relative to WT control cells ± 1 μM CL-316,243. Individual data points plotted ± SEM (n = 3 wells per condition, p values = 0.0008). b. GPAT activity in iWAT homogenates from WT and SAKO mice treated with 1 mg/kg CL-316,243 or vehicle control for 20 minutes. Individual data points plotted ± SEM (n = 3 mice per condition, p value =0.002 WT V vs. CL, 0.019 WT vs. SAKO CL). c. Western blot analysis of GPAT3 and GPAT4 protein levels in lysates from WT and SAKO iWAT and eWAT. Results are representative of three independent experiments, 50, 75 and 100 kDa protein markers indicated in green, pink and blue respectively. d. OCR at 30 min ± 10 μM CL-316,243 in 3T3-L1 adipocytes ± JAK inhibitor I pretreatment for 30 min, normalized to baseline. Individual data points plotted ± SEM (n = 8 wells per condition, p values < 0.0001). e. and f. OCR at 30 min ± 0.5 μM CL-316,243 in WT and SAKO PPDIV with lentiviral STAT3 (WT, S727A or S727D) or GFP overexpression. e. Data are represented as mean ± SEM (n = 12 wells per over expression construct in each genotype, p value < 0.0001 V vs. CL, 0.002 WT CL vs. SAKO CL GFP, and 0.046 WT CL vs. SAKO CL S727A ). f. Individual data points plotted ± SEM (n = 4 wells per condition, p value = 0.029 V vs. CL STAT3, 0.016 V vs. CL 727D, 0.047 GFP vs. STAT3 CL, 0.011 727A vs. STAT3 CL, and 0.024 727A vs. 727D CL). g. Model of FA handling in the fed state (blue arrows) versus the fasted stated (red arrows) and the signaling regulating lipolysis-driven oxidative metabolism (black arrows) in the fasted state. * p value < 0.05 from post hoc analysis after significant two-way ANOVA.

