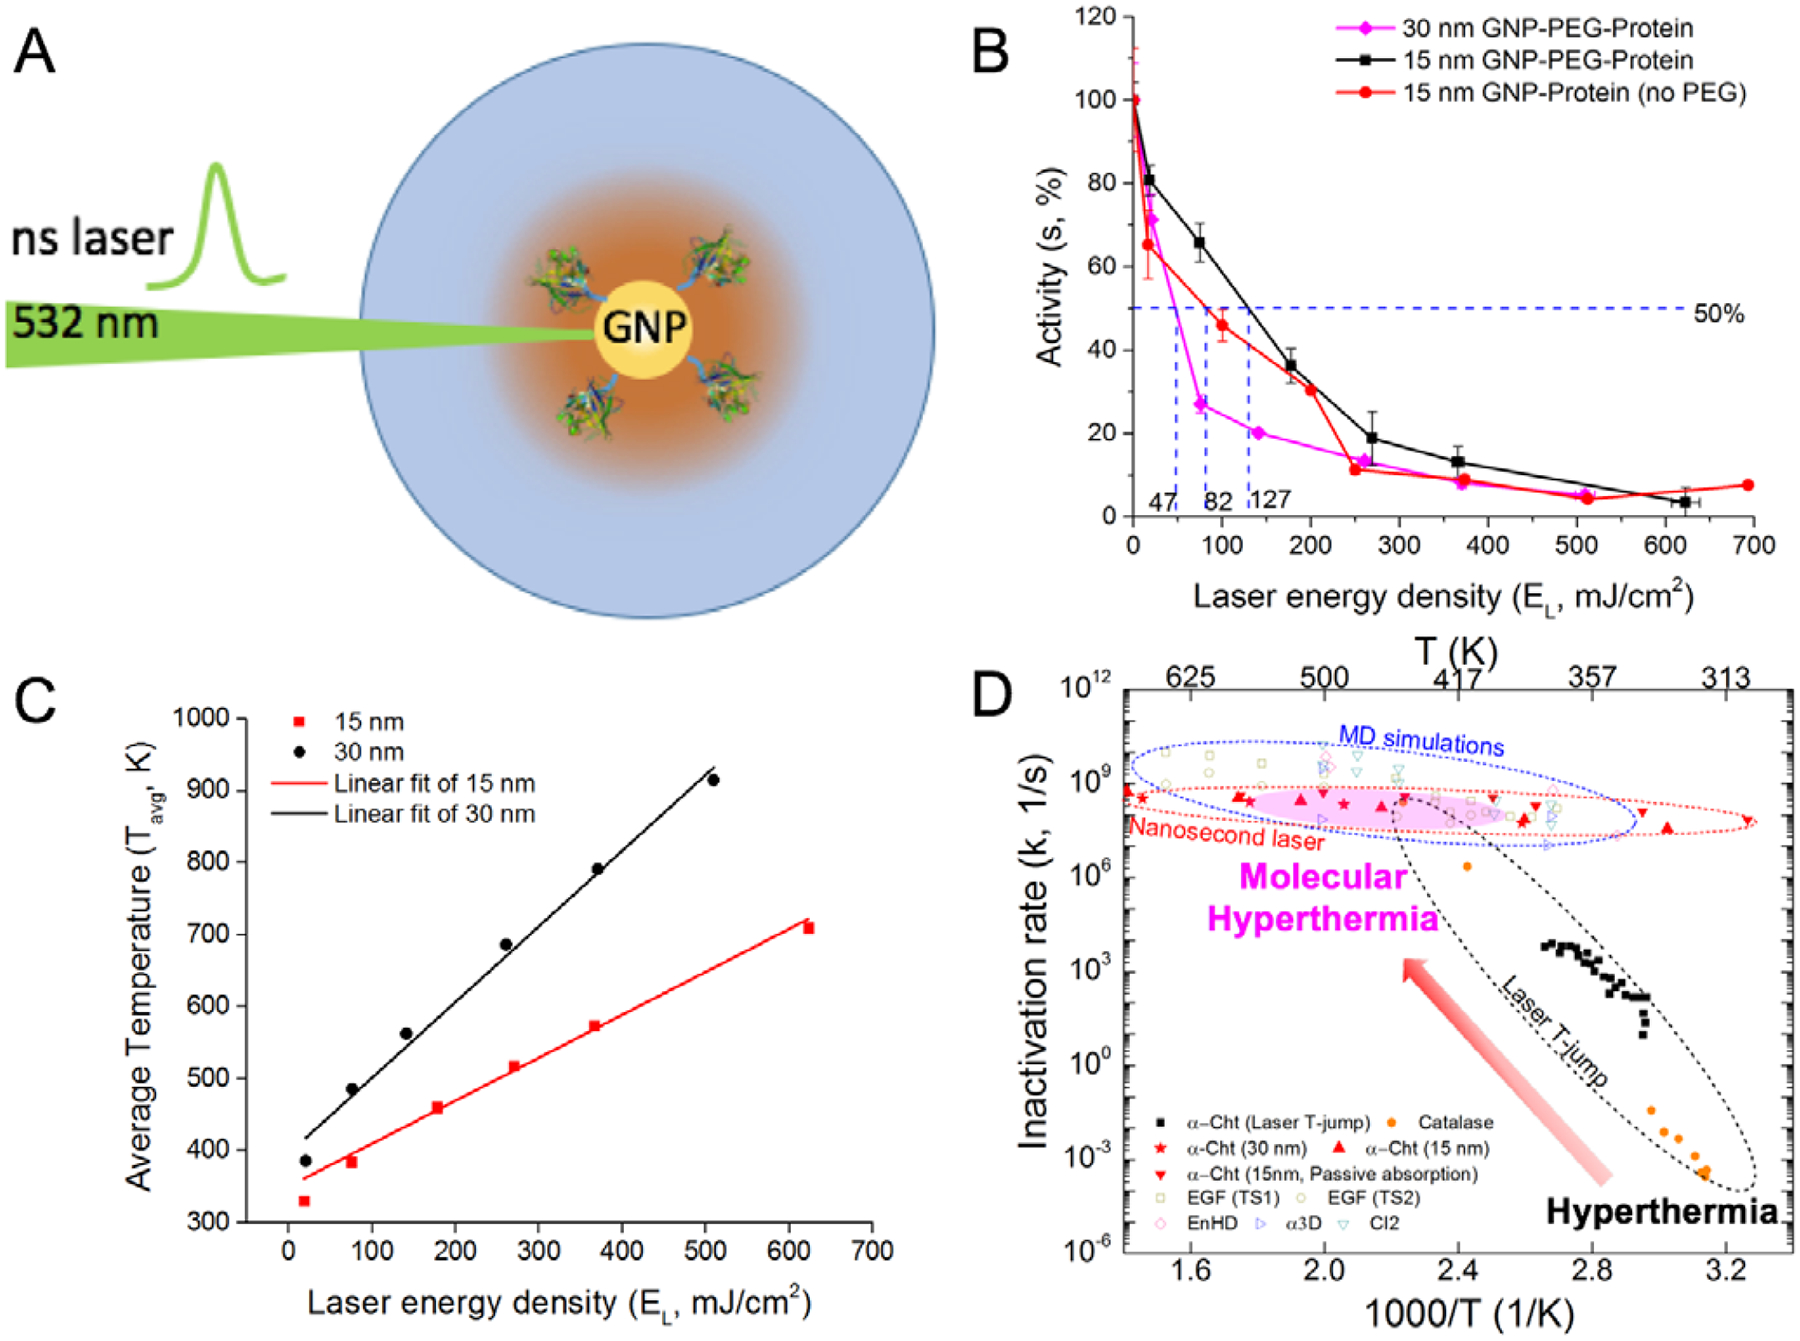
Figure 2:

Molecular hyperthermia enables measurement of protein inactivation rate constant at temperature and time regions. (A) Schematic of molecular hyperthermia setup. Length Ltotal is defined as the center to center distance between the gold nanoparticle (GNP) and protein. (B) Protein activity as function of laser energy density and nanoparticle size (15 and 30 nm) measured in molecular hyperthermia experiments.11 The label GNP-PEG-Protein refers to the case where the protein is covalently conjugated to the GNP using a PEG linker and GNP-PEG (no PEG) label refers to the passive absorption case. (C) Average temperature experienced by the protein (at distance Ltotal) during molecular hyperthermia. (D) Arrhenius plot over a large temperature range (300 – 625 K). Additional data used in this figure is from experimental and molecular simulations of different proteins (α-chymotrypsin (Cht),9, 11 Catalase,13 EGF,17 EnHD,15 α3D,16 CI216).
