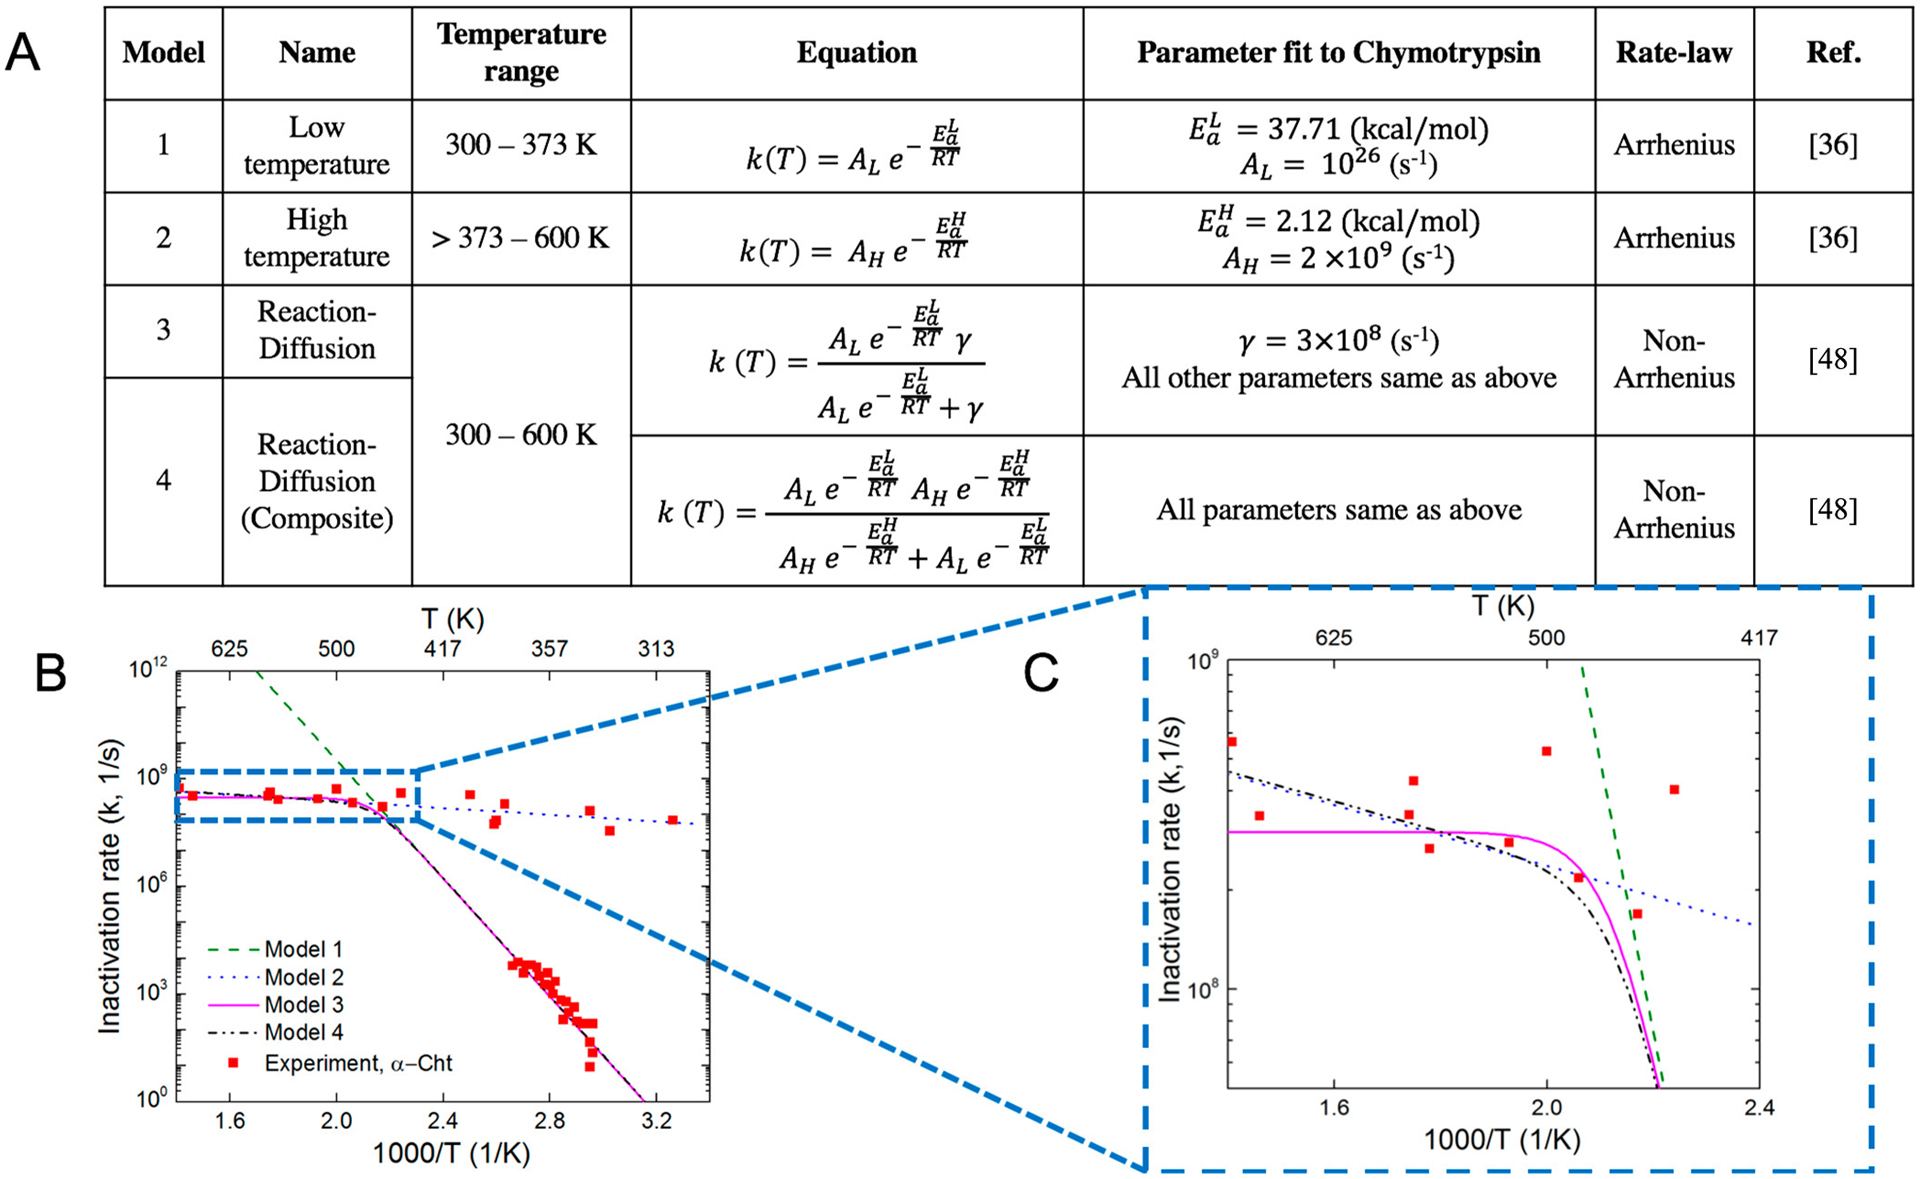
Figure 3:

Comparison of different temperature-dependent kinetic models with experimental results. (A) Different kinetic models categorized based on low and high absolute temperatures (Arrhenius kinetics) and Arrhenius/non-Arrhenius kinetics. (B) Kinetic models for the inactivation rate of enzyme α−Cht, including both low and high temperature range 300 – 600 K (C) magnified of temperature range (417 – 600 K) to illustrate model 3 best represents the experiments for the temperature range, 310 – 600 K, (R2 = 0.84). The R2 values is calculated using the parametric values listed in (A) for the protein enzyme α−Cht.
